Category: Forex Analysis & Ideas

  • CADJPY

    CADJPY

    CADJPY

    I have been eyeing this pair for a while now. Top down analysis indicates we have a bearish imprint in the horizon. On the 6-month time frame, CADJPY is in consolidation.

    CADJPY 6 MONTH
    CADJPY 6M

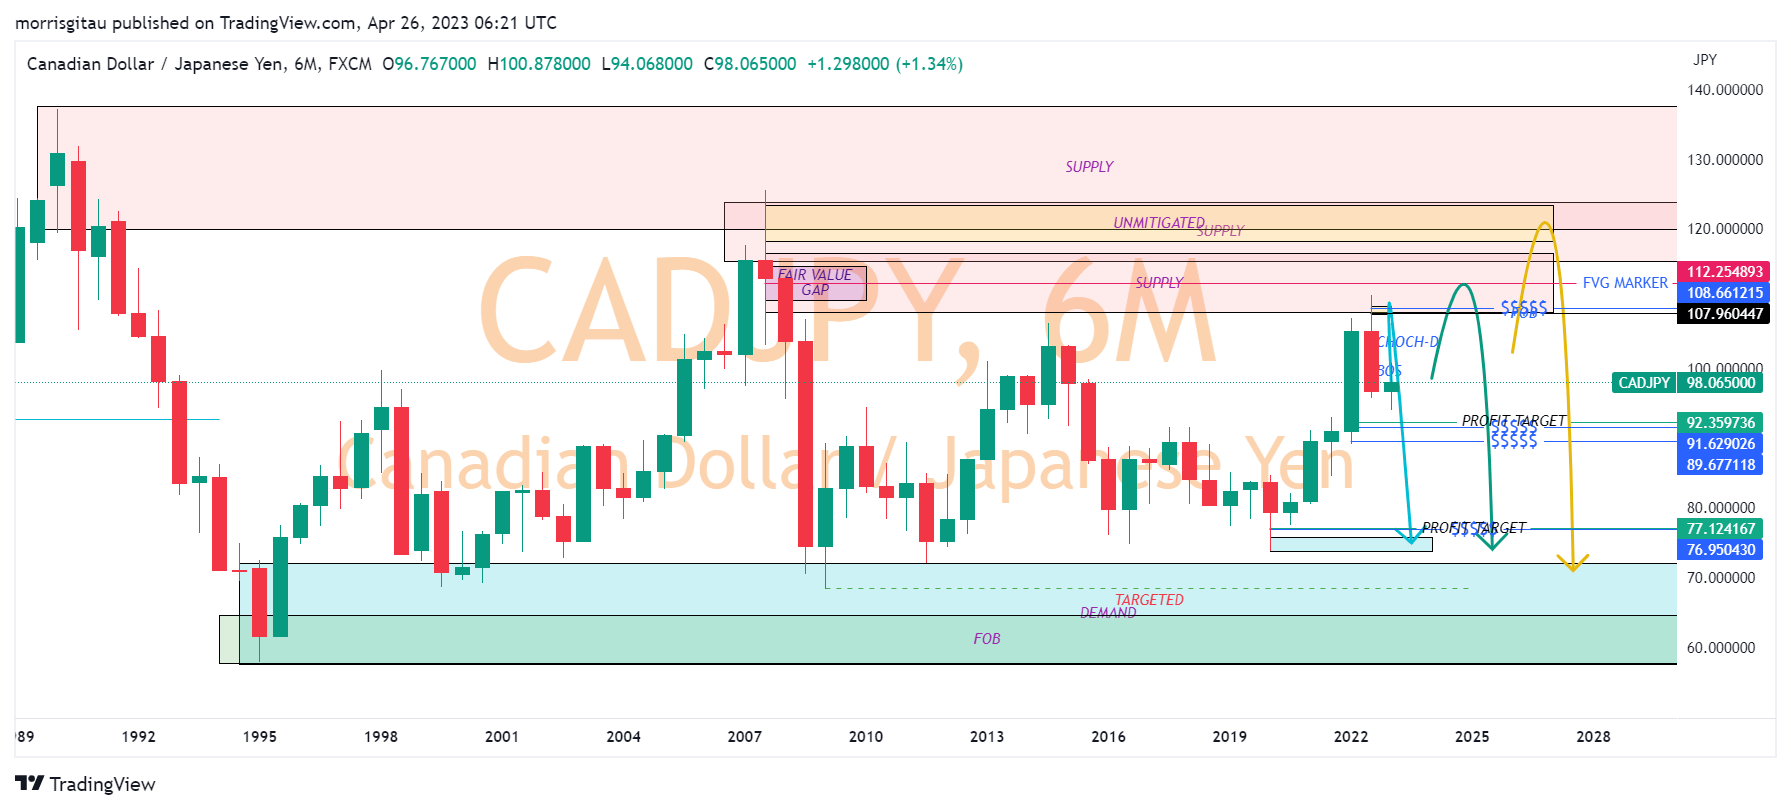
    Dropping down to the 3-month timeframe, we are witnessing the completion of a bullish correction. Moving down to the monthly and daily time frames, we have a change of character on the daily that has created unmitigated supply sitting at 108 price handle. While we have a bearish imprint, I recommend we exercise caution considering there are three possibilities.

    CADJPY 3M
    CADJPY 3M
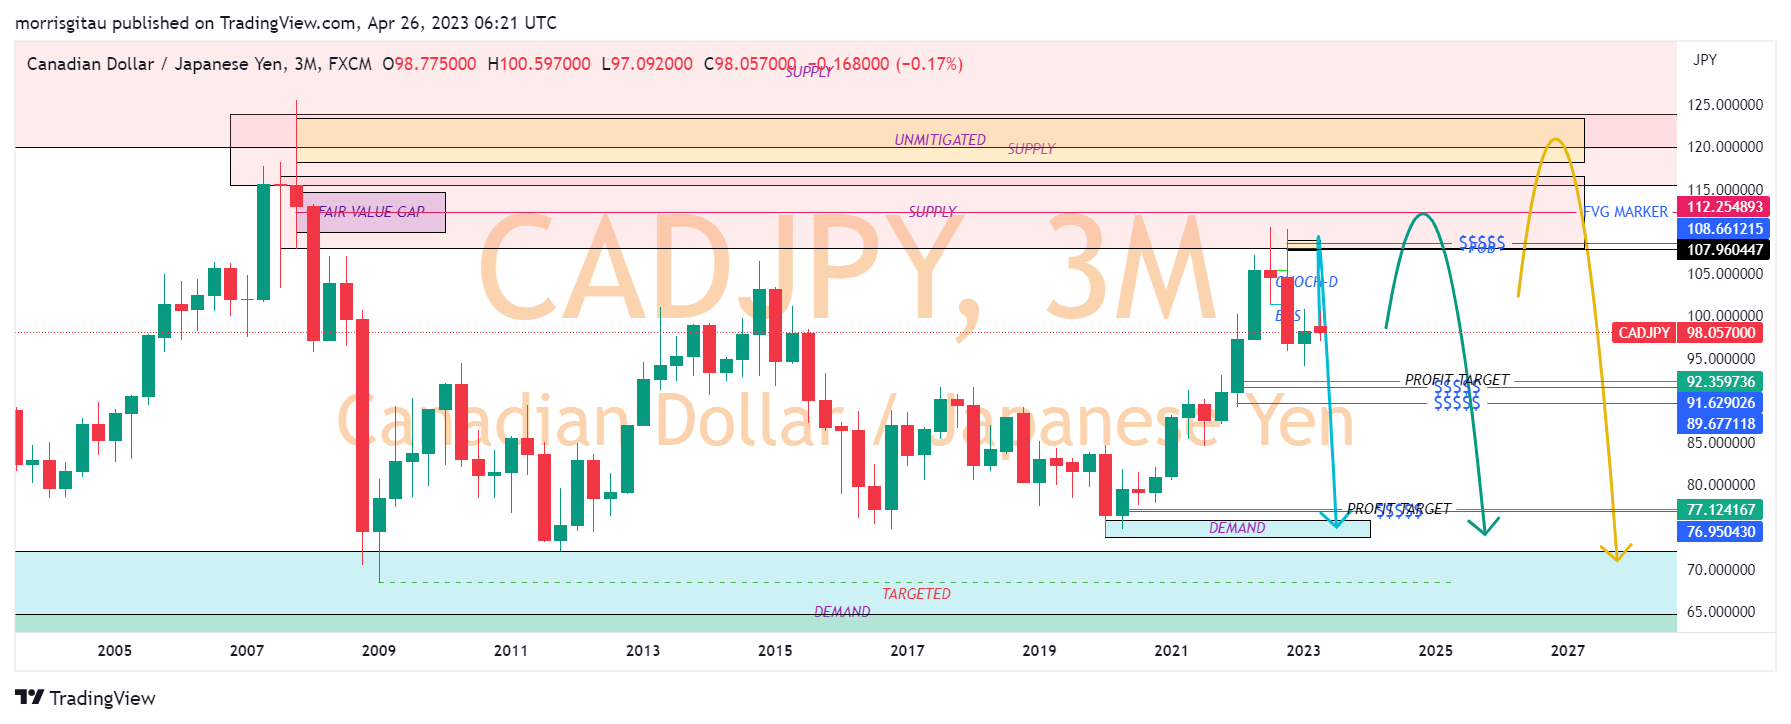
    1. On the daily timeframe, the price could retrace back to the unmitigated supply targeting the fresh order block and liquidity sitting at 107.9 and 108.66 price handles respectively.
    2. Price could rally and clear the fair value gap sitting at 112.25 then drop down.
    3. A further rally could be in the works, though unlikely targeting the unmitigated supply on the monthly timeframe at 120 price handle.

    In my opinion, scenario (1) and (2) have a higher probability of occurrence. We intend to place our sell limit orders at the liquidity sitting at 108.66 price handle and take profit at 92 for the short term and 76 for the long run.


    NB: Our analysis is strictly based on supply and demand, suitable for swing traders.

    Risk Warning: CFDs carry a high level of risk to your capital, and you should only trade with money you can afford to lose. Trading may not be suitable for all investors, so please ensure that you fully understand the risks involved and seek independent advice if necessary.
    Disclaimer: I am not a financial advisor, and I am not telling you where or when to take a trade. I express my personal opinion only. Trading in financial markets involves risk. I am not responsible for any losses incurred due to your trading. I do not recommend any specific trade or action, and any trades you decide to take are your own.


  • GBPCHF TRADE IDEA

    GBPCHF TRADE IDEA

    GBPCHF

    On the one-month timeframe, GBPCHF displays a strong bearish trend, creating new lows. The long-term outlook on the monthly timeframe is largely bearish, though the pair was in a bullish mitigation or correction.

    Dropping down to the weekly timeframe, we see a break in structure that created the new low at 1.0 price handle. Thereafter, there was a strong bullish correction targeting supply at the 1.16 price handle.

    GBPCHF WEEKLY CHART
    GBPCHF WEEKLY

    Since then, we have seen this pair create lower lows, indicating a bearish correction targeting the unmitigated demand (yellow order block).

    GBPCHF DAILY CHART
    GBPCHF DAILY

    Presently, we are monitoring the pair as we anticipate it to push lower and break the key structure (KSD).

    Thereafter, we will have two options:

    1. A minor bullish correction targeting the unmitigated supply at the 1.14 region where it will pick orders and slide further targeting the unmitigated region (orange arrow).
    2. The break in daily volume will result in a further bearish slide targeting unmitigated demand. This option, represented by the red arrow, may not give sellers an opportunity to enter the market. However, buyers can look to enter once demand is mitigated.

    How do we intend to trade this pair? We have a bearish bias in the interim, therefore, we are anticipating Option 1 to play out and pick our sell limit orders sitting at 1.1435 (liquidity) targeting 1.073.

    NB: Our analysis is strictly based on supply and demand, suitable for swing traders.


    Risk Warning: CFDs carry a high level of risk to your capital, and you should only trade with money you can afford to lose. Trading may not be suitable for all investors, so please ensure that you fully understand the risks involved and seek independent advice if necessary.
    Disclaimer: I am not a financial advisor, and I am not telling you where or when to take a trade. I express my personal opinion only. Trading in financial markets involves risk. I am not responsible for any losses incurred due to your trading. I do not recommend any specific trade or action, and any trades you decide to take are your own.


  • GBPNZD FORECAST

    GBPNZD FORECAST

    GBPNZD

    On the 3-month timeframe, GBPNZD has mitigated the long-term demand zone (in blue).

    GBPNZD 3M
    GBPNZD 3MONTHS

    The long-term outlook on the monthly timeframe is largely bearish, though the pair was in a bullish mitigation or correction.

    GBPNZD MONTHLY CHART
    GBPNZD MONTHLY CHART

    After the bullish correction, the pair turned bearish, targeting the unmitigated demand at 1.80.

    Following the geopolitical risks in the United Kingdom, the GBPNZD collapsed to 1.81 levels and quickly formed a new high at the 2.02 price handle. The pair settled then settled at the demand at 1.88 price handle. Thereafter, the supply at 1.98 to 2.02 levels was mitigated.

    GBPNZD DAILY
    GBPNZD DAILY CHART

    Presently, we are anticipating a reversal on the horizon, and we have three options for selling limits:

    1. Unmitigated supply at 2.00 per handle.
    2. a fair value gap at 2.005 price handle.
    3. Unmitigated supply at 2.02 price

    Our projected exit sits at the demand level of 1.889 or the fair value gap of 1.85815 price handles.

    Once the market confirms our analysis we shall update this forecast accordingly. Kindly note, we are swing traders looking for long term holding opportunities as opposed to short term trading.


    Risk Warning: CFDs carry a high level of risk to your capital, and you should only trade with money you can afford to lose. Trading may not be suitable for all investors, so please ensure that you fully understand the risks involved and seek independent advice if necessary.

    Disclaimer: I am not a financial advisor, and I am not telling you where or when to take a trade. I express my personal opinion only. Trading in financial markets involves risk. I am not responsible for any losses incurred due to your trading. I do not recommend any specific trade or action, and any trades you decide to take are your own.


  • USDJPY FORECAST

    USDJPY FORECAST

    USDJPY FORECAST

    On the monthly timeframe, which represents our long-term forecast, we see a mitigation of a previous supply at 150 price handles. This was achieved by the end of 2022. Thereafter in 2023, early in the year, profit-taking pushed the dollar to a previous unmitigated demand at 128 price handle. This confirmed a bearish order flow was at play.

    USDJPY DAILY CHART
    USDJPY

    After forming this new low, USDJPY broke the daily structure, confirming a change of character (CHOCH) on the daily time frame. The CHOCH indicates a bullish correction on the horizon. Presently, the market has settled in the demand zone at a price handle of 131.

    We intend to go long on this pair. We have our buy limit orders sitting at 128.7 with three optional targets.

    1. The unmitigated supply is sitting at 142.
    2. The fresh supply is sitting at 145.
    3. The unmitigated supply is sitting at 147–148.

    Our long-term bias for USDJPY is bearish with a short-term bullish correction. We intend to review our analysis once the 142-148 supplies are mitigated and look for short-term opportunities.

    NB: Our analysis is strictly based on supply and demand, suitable for swing traders.
    Risk Warning: CFDs carry a high level of risk to your capital, and you should only trade with money you can afford to lose. Trading may not be suitable for all investors, so please ensure that you fully understand the risks involved and seek independent advice if necessary.
    Disclaimer: I am not a financial advisor, and I am not telling you where or when to take a trade. I express my personal opinion only. Trading in financial markets involves risk. I am not responsible for any losses incurred due to your trading. I do not recommend any specific trade or action, and any trades you decide to take are your own.


  • USDCAD IDEA

    USDCAD IDEA

    USDCAD IDEA

    The monthly timeframe indicative of the long-term trend shows a resilient and bullish US Dollar versus the Canadian Dollar. The target is the 1.54 price handle. This price handle is the supply that triggered the bearish momentum that created the low at 1-0.99 price handles. This bullish correction is caught in a consolidation between the demand and supply at 1.2 and 1.37 respectively. An impulsive move is signaling in the horizon.


    USDCAD 3 MONTHS
    USDCAD 3M

    On the weekly timeframe, we are cognizant of the unmitigated demand at 1.21 that could be a long-term profit target should the market create new long-term lows. On the Daily timeframe, we have a minor consolidation structure with a bearish imprint.

    USDCAD ANALYSIS
    USDCAD DAILY

    Once we have a confirmed break in structure and change of character (CHOCH), we anticipate a return to supply where we have a combination of liquidity and fresh unmitigated supply zones; 1.37 price handle. At this level we anticipate our sell orders to be triggered targeting the key daily structure below at the 1.30 price handle. Once price settles at this region;

    1. The price could rebound upwards.
    2. The price could slide further towards the unmitigated demand at 1.2 price handle.

    We will update our outlook as the market gives us new information.

    Our analysis is based on smart money concepts; supply and demand. We recommend this set up for swing and position traders.

    Risk Warning: CFDs carries a high level of risk to your capital and you should only trade with money you can afford to lose. Trading may not be suitable for all investors, so please ensure that you fully understand the risks involved and seek independent advice if necessary.
    Disclaimer: I am not a financial advisor and I am not telling you where or when to take a trade. I express my personal opinion only. Trading financial markets involve risk. I am not responsible for any losses incurred due to your trading. I do not recommend any specific trade or action, and any trades you decide to take are your own.


  • SWISS FRANC VS JAPANESE YEN (CHFJPY)

    SWISS FRANC VS JAPANESE YEN (CHFJPY)

    SWISS FRANC VS JAPANESE YEN (CHFJPY)

    The monthly timeframe which represents our long-term outlook indicates a bearish outlook. We are witnessing a return to an old supply in the region of 147 price handles.

    Chart or CHFJPY
    CHFJPY 3 MONTHS

    Currently, we are witnessing a bullish correction targeting the 147-149 price handles. This bullish correction is fueled by the resurgent Swiss Franc across major pairs owing to the prevailing banking crisis and uncertainty in Europe. Mitigation of the supply at this regions will trigger a continuation of the bearish slide targeting 127-135 regions. How do we intend to trade this pair? We have confluence presenting itself in the form of liquidity and fresh supply zones at 147.8-148.4. We are placing our sell limit order at 148.5 targeting 138.9 (conservative target).


    CHART ON CHF JPY DAILY
    DAILY CHART CHFJPY

    If the pair break structure at 137.6;

    1. There is likely to be a bullish correction that will present additional sell limits.
    2. The bearish slide will aggressively target the unmitigated zone of 127-132.

    We will update our outlook as the market continues to give us additional information. Kindly note our analysis is based on smart money concepts; supply and demand. As you consume our content and analysis, do note we are swing traders.


    Risk Warning: Trading Derivatives carries a high level of risk to your capital and you should only trade with money you can afford to lose. Trading Derivatives may not be suitable for all investors, so please ensure that you fully understand the risks involved and seek independent advice if necessary.
    Disclaimer: I am not a financial advisor and I am not telling you where or when to take a trade. I express my personal opinion only. Trading financial markets involve risk. I am not responsible for any losses incurred due to your trading. I do not recommend any specific trade or action, and any trades you decide to take are your own.


  • US 30 TRADE IDEA

    US 30 TRADE IDEA

    US 30 TRADE IDEA

    The US30, also known as the Dow Jones Industrial Average, is a stock market index that measures the stock performance of 30 large, blue-chip companies trading on the New York Stock Exchange and NASDAQ. Inversely related to the US Dollar, they move in the opposite direction. A rise in the US 30 signals a decline of the US Dollar and vice versa.

    On the weekly time frame which represents our long-term outlook we have a bearish set up. The index failed to break a previous high and created a new low. We are witnessing signs of a strong dollar recovery that will result in the bearish continuation of the US30.

    usd30 analysis
    USD 30 DAILY

    On the daily time frame, we registered a break in structure. Presently we are witnessing a bullish correction of the bearish impulse move. We have two options of entry;

    1. The aggressive entry represented by the unmitigated daily supply at 33,500 that broke structure.
    2. Conservative entry represented by the unmitigated swing supply structure that engineered the move represented by 34,080 price handle.

    While we do have a bearish imprint on this index, we favour the conservative entry though our analysis shows the aggressive entry is still valid.

    We have two exits favoring short term (scalpers &day traders) and long-term (swing & position) traders, 30,400 and 28,300 respectively.

    We have a similar outlook on US 500 index.

    Our analysis and trade strategy is based on smart money concepts (SMC), particularly supply and demand. We are naturally swing traders with long term market outlook influencing our analysis.

    Risk Warning: CFDs carry a high level of risk to your capital, and you should only trade with money you can afford to lose. Trading may not be suitable for all investors, so please ensure that you fully understand the risks involved and seek independent advice if necessary.
    Disclaimer: I am not a financial advisor, and I am not telling you where or when to take a trade. I express my personal opinion only. Trading in financial markets involves risk. I am not responsible for any losses incurred due to your trading. I do not recommend any specific trade or action, and any trades you decide to take are your own.
  • US DOLLAR MEXICAN PESO FORECAST

    US DOLLAR MEXICAN PESO FORECAST

    US DOLLAR MEXICAN PESO

    The long term outlook on the monthly timeframes shows a very strong US Dollar against the Mexican Peso (MXN). The Mexican Peso has strongly recovered against the Dollar since May 2020, this analysis is similar to the weakness of the Dollar against the South African Rand. The price levels have eventually returned to the demand zone at 17-18 price handle.

    USDMXN WEEKLY
    USDMXN WEEKLY
    USDMXN DAILY
    USDMXN-DAILY

    Naturally we adopt smart money approach in our analysis. The institutional order flow show that there is a change of character on the Daily timeframe. After the change in character we expect a minor correction to pick buy orders sitting at the 17.9-17.8 levels before resuming the bullish momentum targeting the 20 price handles with potential to go even higher to mitigate the fresh supply sitting at the 23 price handle.

    Using supply and demand approach, we have a bullish bias with our entries placed at the 17.8-17.9 levels. We are targeting the 19-22 price handles for extreme swing traders.

    NB: Our analysis is strictly based on supply and demand, suitable for swing traders.
    Risk Warning: CFDs carry a high level of risk to your capital, and you should only trade with money you can afford to lose. Trading may not be suitable for all investors, so please ensure that you fully understand the risks involved and seek independent advice if necessary.
    Disclaimer: I am not a financial advisor, and I am not telling you where or when to take a trade. I express my personal opinion only. Trading in financial markets involves risk. I am not responsible for any losses incurred due to your trading. I do not recommend any specific trade or action, and any trades you decide to take are your own.
  • US DOLLAR VS SOUTH AFRICAN RAND, USDZAR SHORT IDEA

    USDZAR SHORT IDEA

    Exotic currency pairs do possess a certain allure to experienced traders in terms of returns. The South African Rand (ZAR) has been battered lately due to macroeconomic data and political upheavals experienced lately. These geopolitical and economic risks are correctly priced into the market

    USD ZAR
    USDZAR

    Using the smart money concepts, we are witnessing a return to a previous supply established in 2021 and an elimination of price inefficiency. The risks highlighted above only serve to drive the price back to the identified supply.

    USDZAR ANALYSIS
    USDZAR DTF

    Currently, we do not have a confirmed set up though market data indicates we are likely to witness a breakout in the coming weeks. On the Daily chart, we are waiting for a break of the daily structure at the 18 price handle. Once this is confirmed, we expect a retracement to the confluence of fresh supply and liquidity sitting at 18.5 price handle. At that price, we will place our sell orders targeting the downside 17-16.5 price handle. Should the price fail to break lower after consolidation and instead breaks higher, this setup is declared invalid and we shall adjust accordingly.

    NB: Our analysis is strictly based on supply and demand, suitable for swing traders.
    Risk Warning: CFDs carry a high level of risk to your capital, and you should only trade with money you can afford to lose. Trading may not be suitable for all investors, so please ensure that you fully understand the risks involved and seek independent advice if necessary.
    Disclaimer: I am not a financial advisor, and I am not telling you where or when to take a trade. I express my personal opinion only. Trading in financial markets involves risk. I am not responsible for any losses incurred due to your trading. I do not recommend any specific trade or action, and any trades you decide to take are your own.
  • BITCOIN/ US DOLLAR (BTC/USD) OUTLOOK

    BITCOIN/ US DOLLAR (BTC/USD) OUTLOOK

    Naturally, risk-averse individuals prefer cryptocurrencies, metals, and the Japanese Yen as safe-haven assets when the dollar is unstable. Recently the banking crisis in America and Europe has resulted in the decline of the US Dollar against major currency pairs.

    Bitcoin and US dollar
    BTCUSD

    On the long-term monthly and weekly timeframes, we have a strong bearish decline of Bitcoin against the dollar targeting the 12,000-15,000 price handles. In the short run, due to the crisis mentioned above, Bitcoin has been resurgent against the dollar. Using smart money concepts of supply and demand, we anticipate Bitcoin to mitigate the fresh supply sitting at a 29,000 price handle. Once it mitigates we have two options;

    1. If it breaks above (blue arrow), we expect it to rise further targeting the 40,000-50,000 price handle.
    2. If it mitigates and fails to break higher, we will look for sell opportunities targeting the 12,000- 15,000 price handles.

    We have a bias for option 2, where Bitcoin is expected to register a further decline against the dollar. Therefore we will be in the look out for change in structure and confirmation in break of structure.

    The above options will only be confirmed on the lower timeframes, preferably the 4-hour chart.

    NB: Our analysis is strictly based on supply and demand, suitable for swing traders.

    Risk Warning: CFDs carry a high level of risk to your capital, and you should only trade with money you can afford to lose. Trading may not be suitable for all investors, so please ensure that you fully understand the risks involved and seek independent advice if necessary.
    Disclaimer: I am not a financial advisor, and I am not telling you where or when to take a trade. I express my personal opinion only. Trading in financial markets involves risk. I am not responsible for any losses incurred due to your trading. I do not recommend any specific trade or action, and any trades you decide to take are your own.