Global financial markets are bracing for a possible Fed rate cut. Accordingly, forex markets have priced in the anticipated rate cut. September CPI data indicated US inflation is on course towards 2%; seems like the prevailing interest rates are working.
Blackrock thinks the Fed will be cautious with a 25-bps rate cut as opposed to a 50-bps rate cut. There is also the remote possibility that the Fed will be cautious and maintain the rates. Ostensibly, it seems the markets have aggressively priced in a rate cut that has seen the dollar weaken against major currencies.
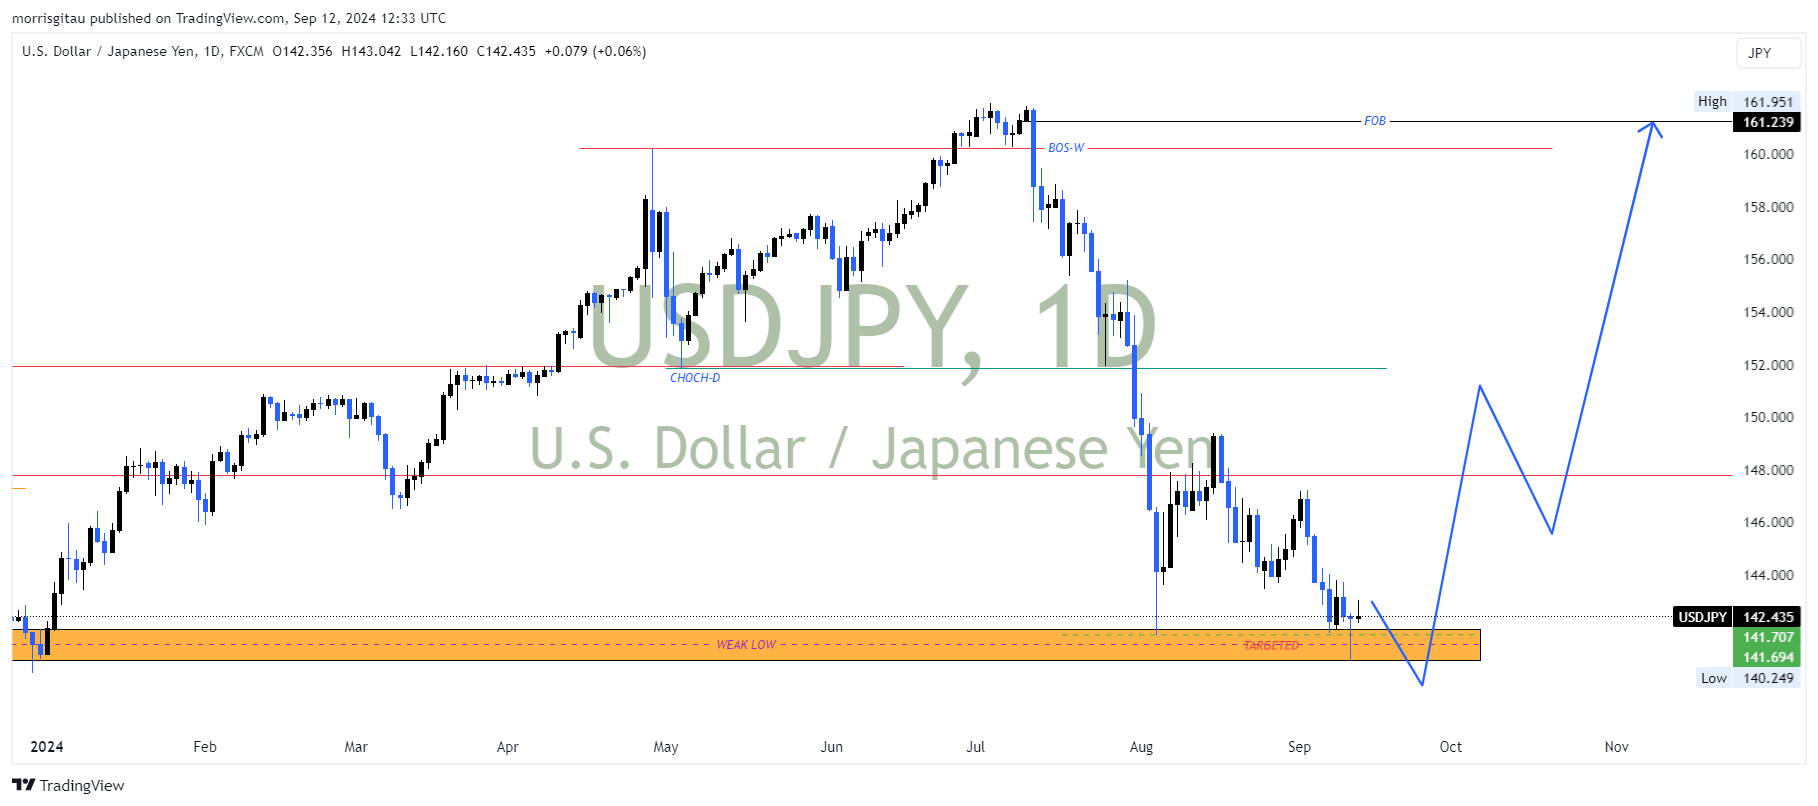
Looking at cross Yen pairs, bearish momentum is dominant in Q3 OF 2024. However, we have seen price imbalance and price inefficiency across all Yen pairs that must be corrected. For this imbalance to be corrected, we require the US Dollar to rise. All factors held constant, retaining rates or cutting rates lesser than expected will spook the markets and we could see the dollar strengthen against the Yen and other major global currencies.
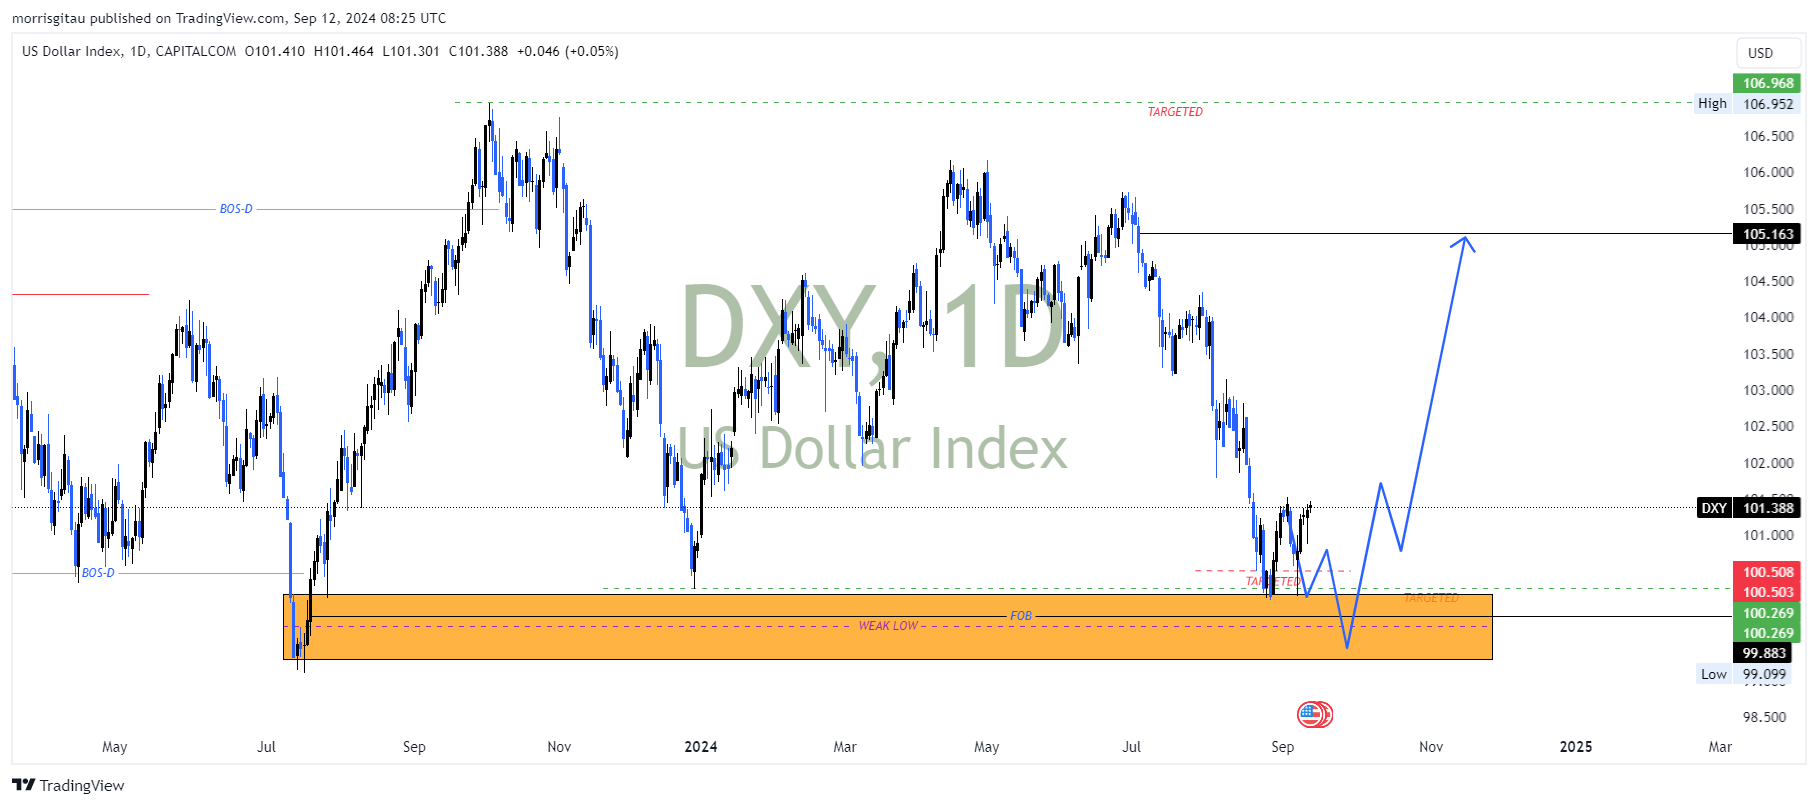
US DOLLAR INDEX
Turning to the US Dollar index, we see a potential for further weakening before the index rises targeting 105 to 110 price levels.
In Q1, 2024 we saw a strong dollar fueled by inflation and increasing global oil prices. In Q2,2024, our forex outlook focuses on DXY, EURGBP and USDCAD as the dollar declines due to profit taking.
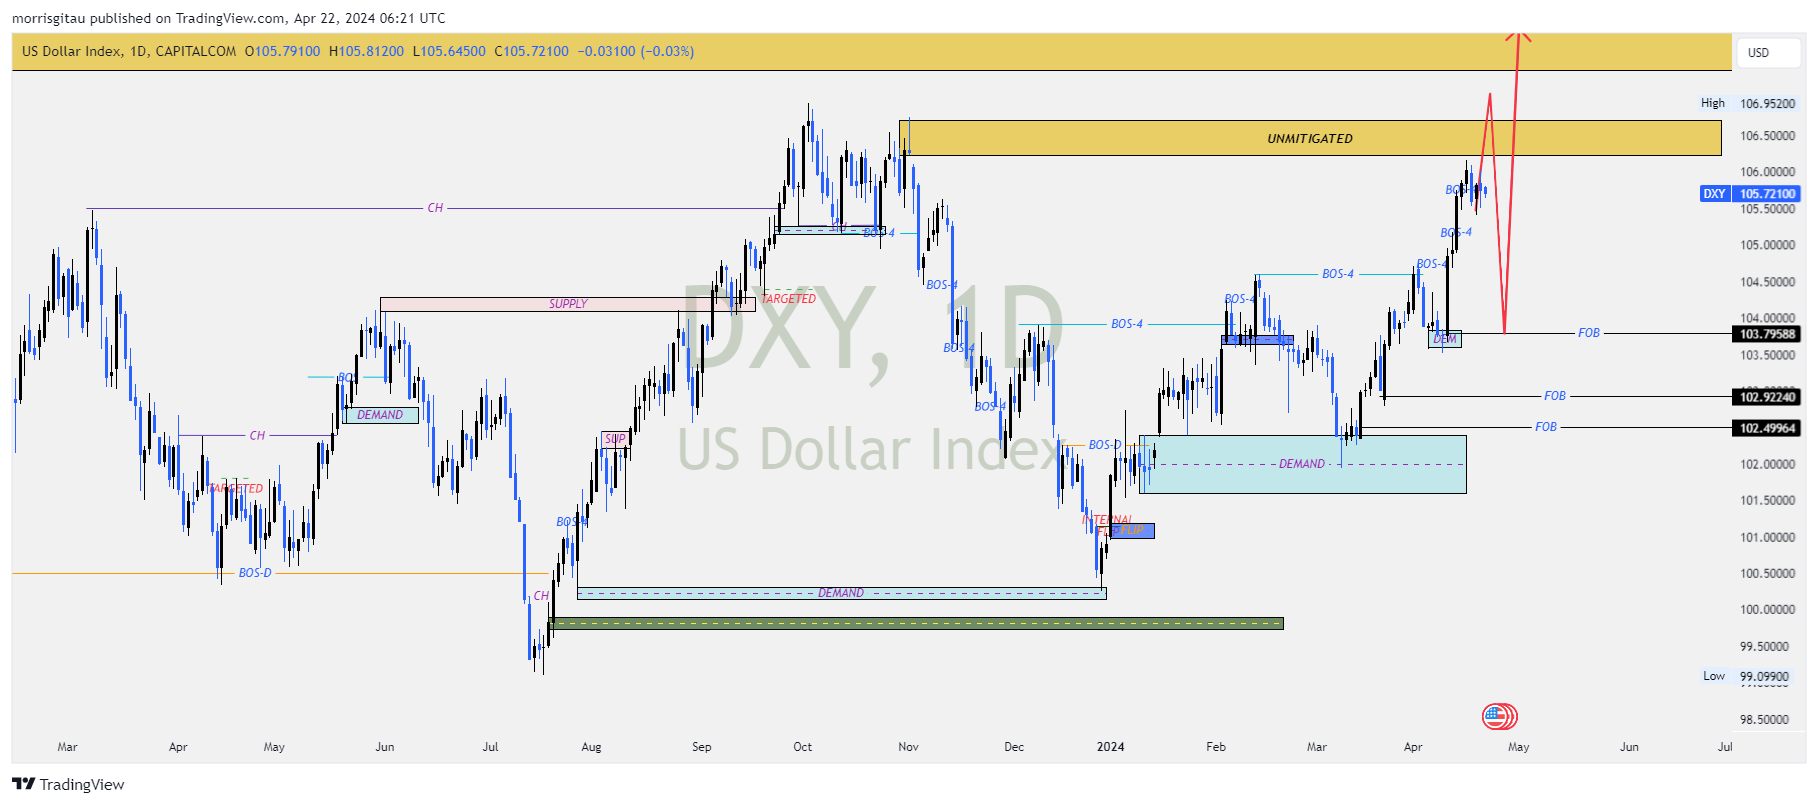
DXY
DOLLAR INDEX CHART
DXY broke above a key level of supply indicating a bullish momentum. Presently (22.04.2024) we are anticipating a final push upwards to contact a previous unmitigated supply. Thereafter we expect profit taking to take place and the DXY to push lower, consequently, cross USD pairs will be on a bullish correction for the short term. The target for profit taking is the demand at 103.78 price handle.
EURGBP
EURGBP CHART
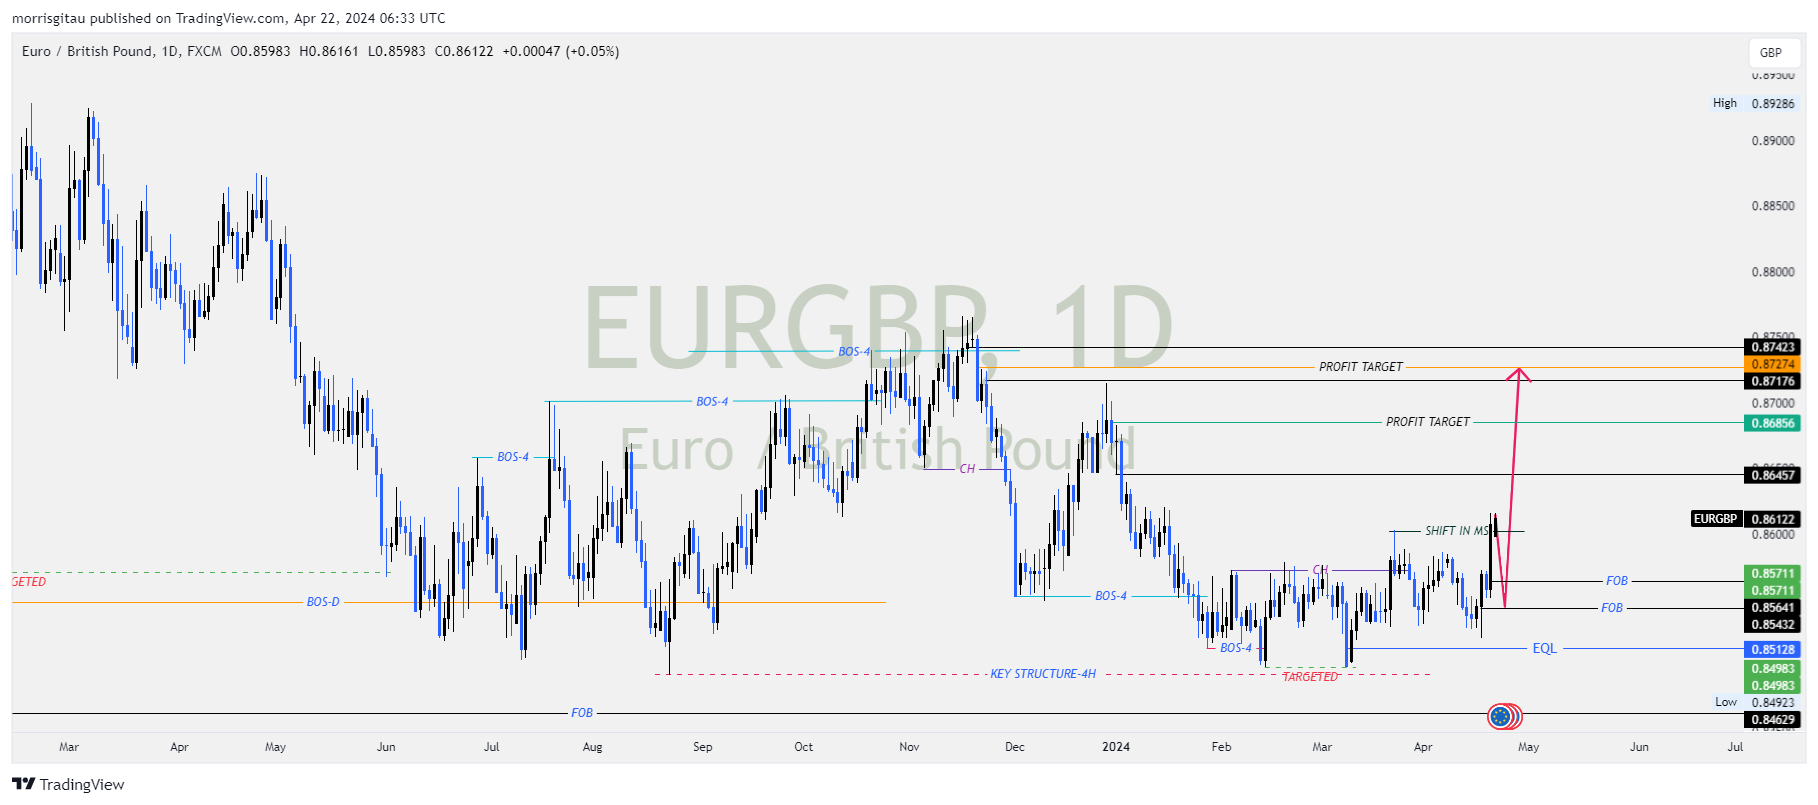
The overall trend on the monthly chart is bullish. On the weekly and daily charts, we have a bearish market structure indicating we are in a correction.
On the 4 hour chart, we have a confirmed shift in market structure that seeks to correct a previous unmitigated supply. I am looking to trade the bullish correction thereafter targeting the disequilibrium between 0.85 to 0.87.
USDCAD
USDCAD CHART
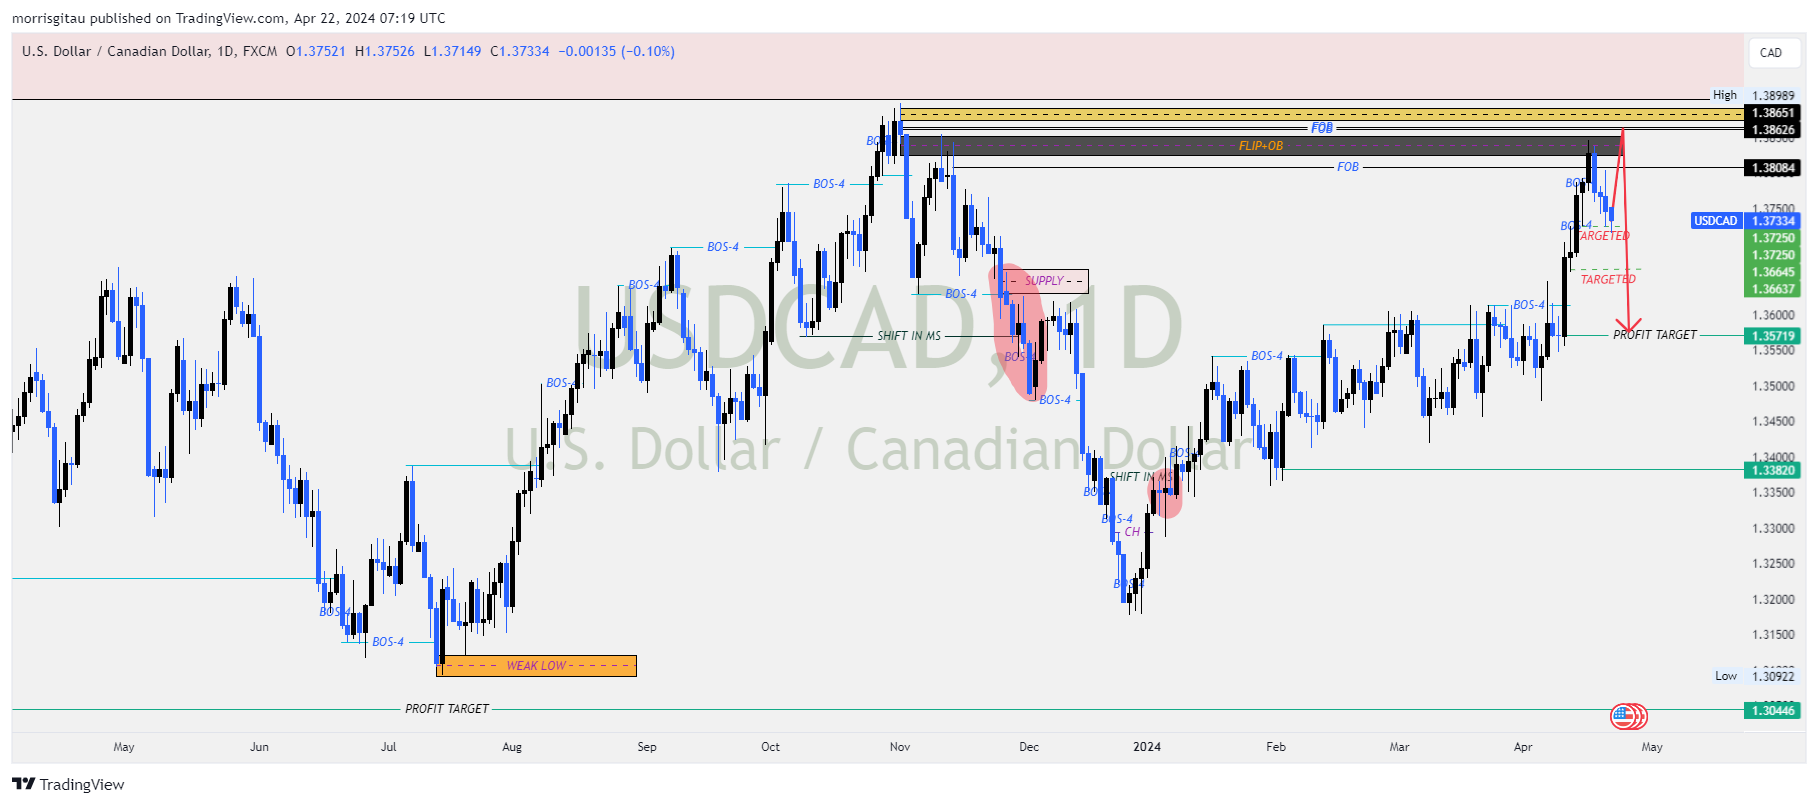
On the monthly and weekly charts, we have bearish price action.. After a strong bearish run in 2021, the price sought to correct previous imbalance that is about to come to an end. Presently (22.04.2024), we expect price to make one final push higher, thereafter we will be looking for reversal signs.
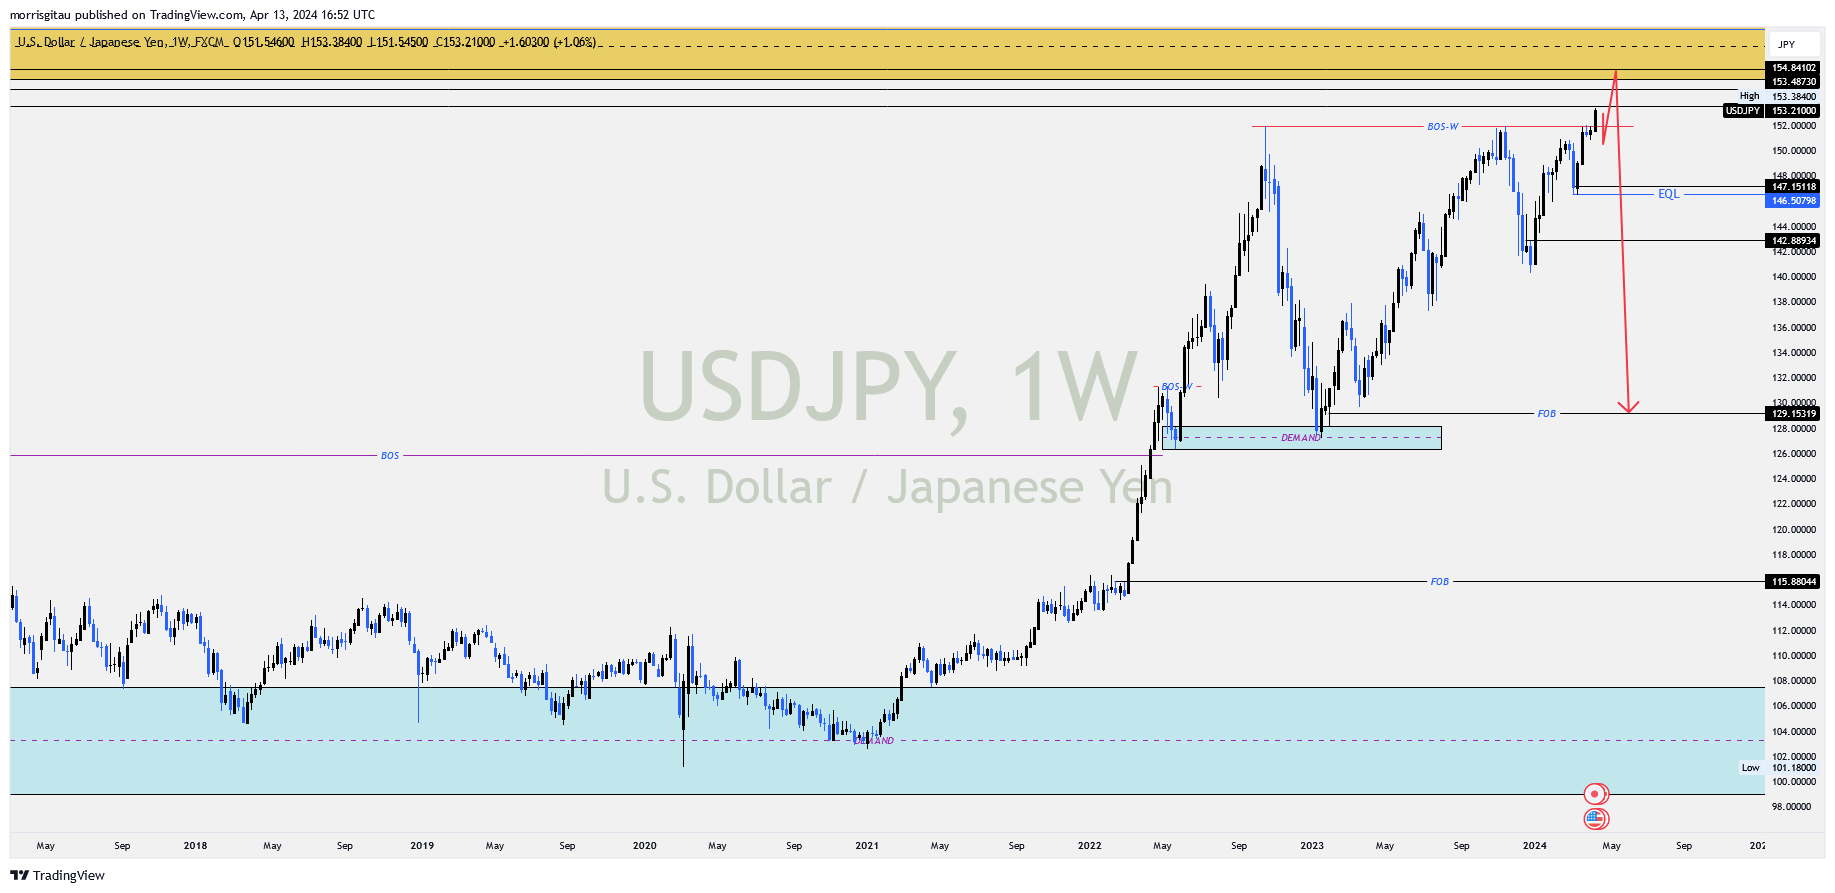
On the monthly chart, we have a larger bearish trend. Presently, the price seems to be seeking the unmitigated supply at 156 price handle. Once we have a mitigated supply, we will be looking for sell limit orders targeting the monthly fair value gap and flip zone at 116.5 price handle.
On the weekly charts, upon refinement. we have equal highs at 159 price handle representing a strong liquidity zone in addition to the unmitigated order block at 153 price handle.
On the daily charts, we maintain the same bullish bias in Q2. Thereafter we will be looking for sell orders.
Here are my thoughts on the forex outlook 2024. We have had multiple pairs showing signs of reversal and continuation. I will use supply and demand concepts to analyze where I think the market will head in 2024.
GBPUSD
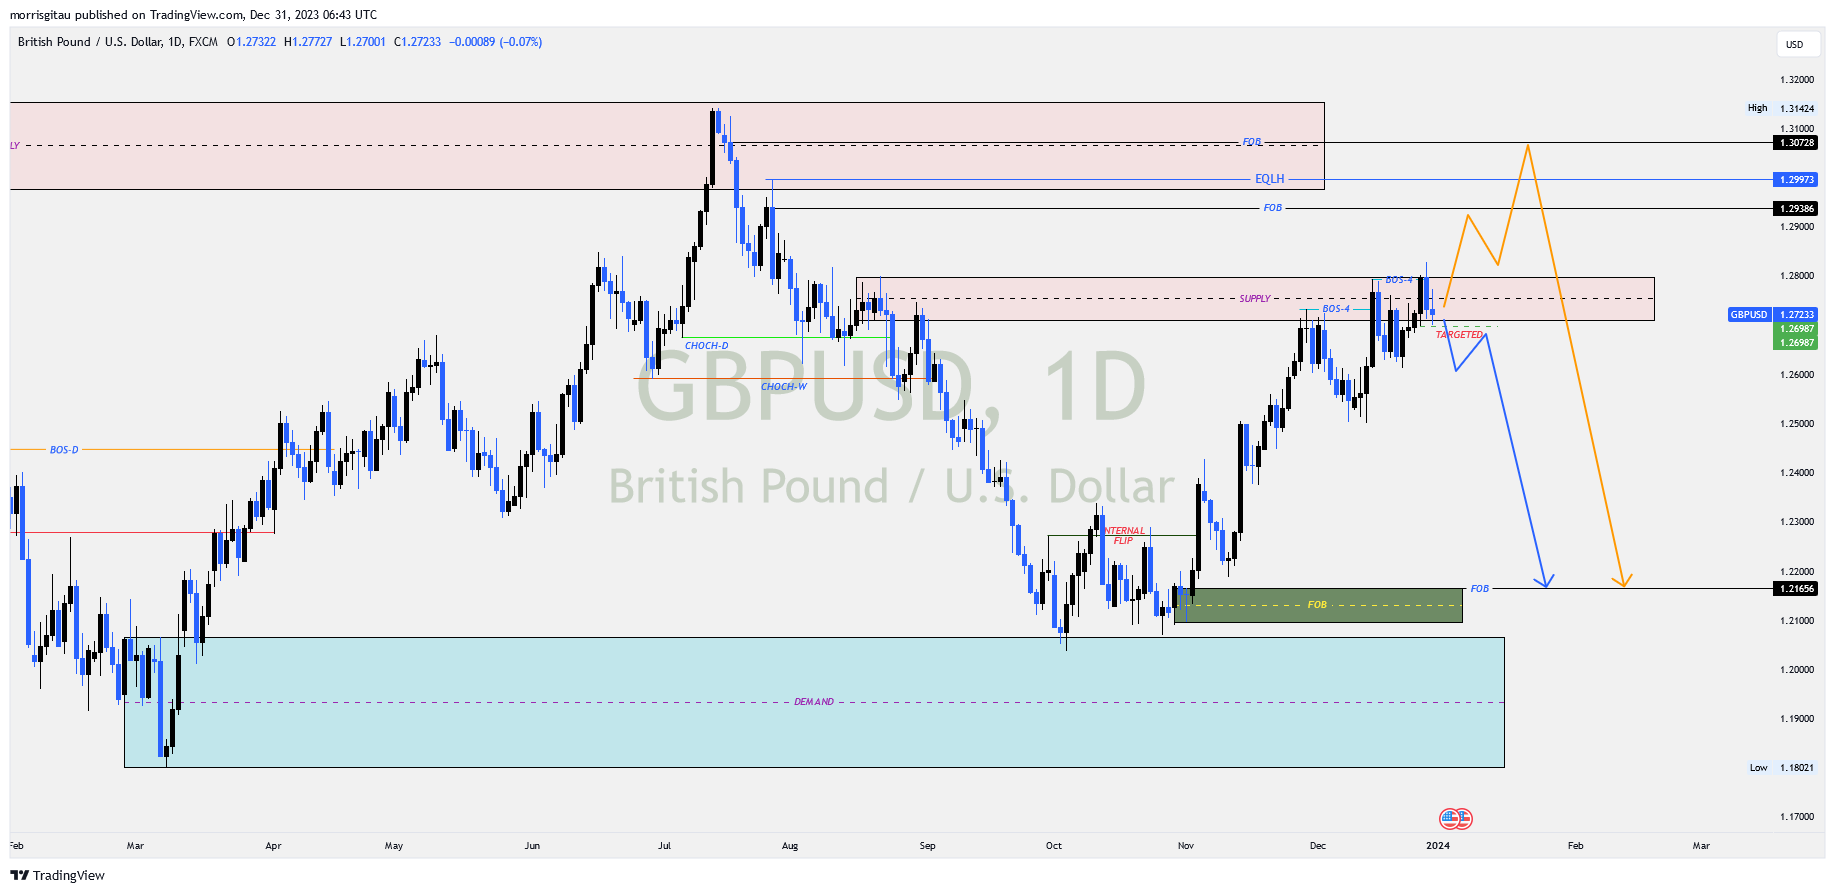
On the monthly charts we have a long term bearish scenario. After a break of structure, the price hit the demand zone and corrected for the better part of 2023.
Moving down to the weekly charts, we see a mitigation of a previous supply, thereafter there was a reaction to the downside creating a bearish order flow.
On the daily charts, we have correction that seems to have come to an end. We have a bearish bias with no confirmation. We are awaiting for a break of key price levels to confirm our bearish outlook. If that happens, we are targeting the demand at 1.21656.
Should the market break higher, we are awaiting for it to settle at 1.20-1.30 price levels.
GBPUSD CHART
AUDUSD
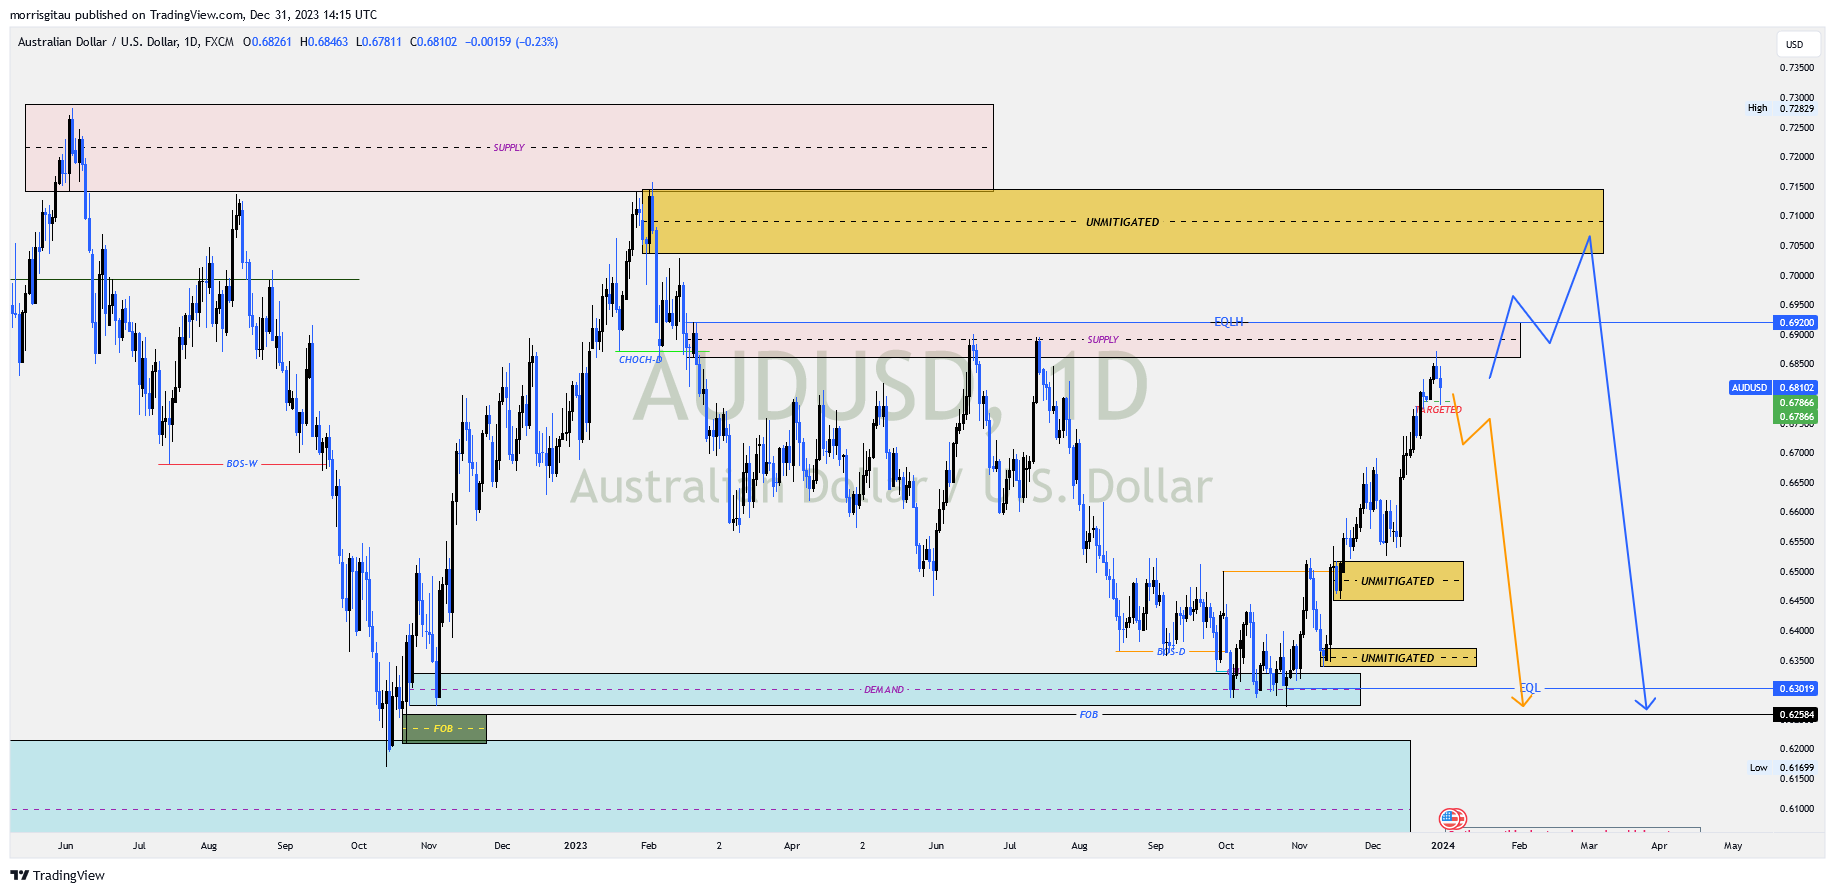
On the monthly chart we have a bearish long term outlook. The price completed a correction at 0.90-1. Thereafter we are in a bearish continuation on the monthly chart.
On the weekly charts, we are nearing the end of a bullish correction that may reverse or continue slightly higher. Looking closely, we also seem to be in a consolidation awaiting a proper breakout, our bias presently is a bearish set up though we do not have confirmation.
Presently, on the daily charts, we are waiting for a clear direction, either a break to the upside targeting liquidity at 0.692 or higher targeting the unmitigated supply at 0.7. Alternatively, we could have a break to the downside targeting the liquidity at 0.63 or fresh demand at 0.626.
AUDUSD CHART
USDJPY
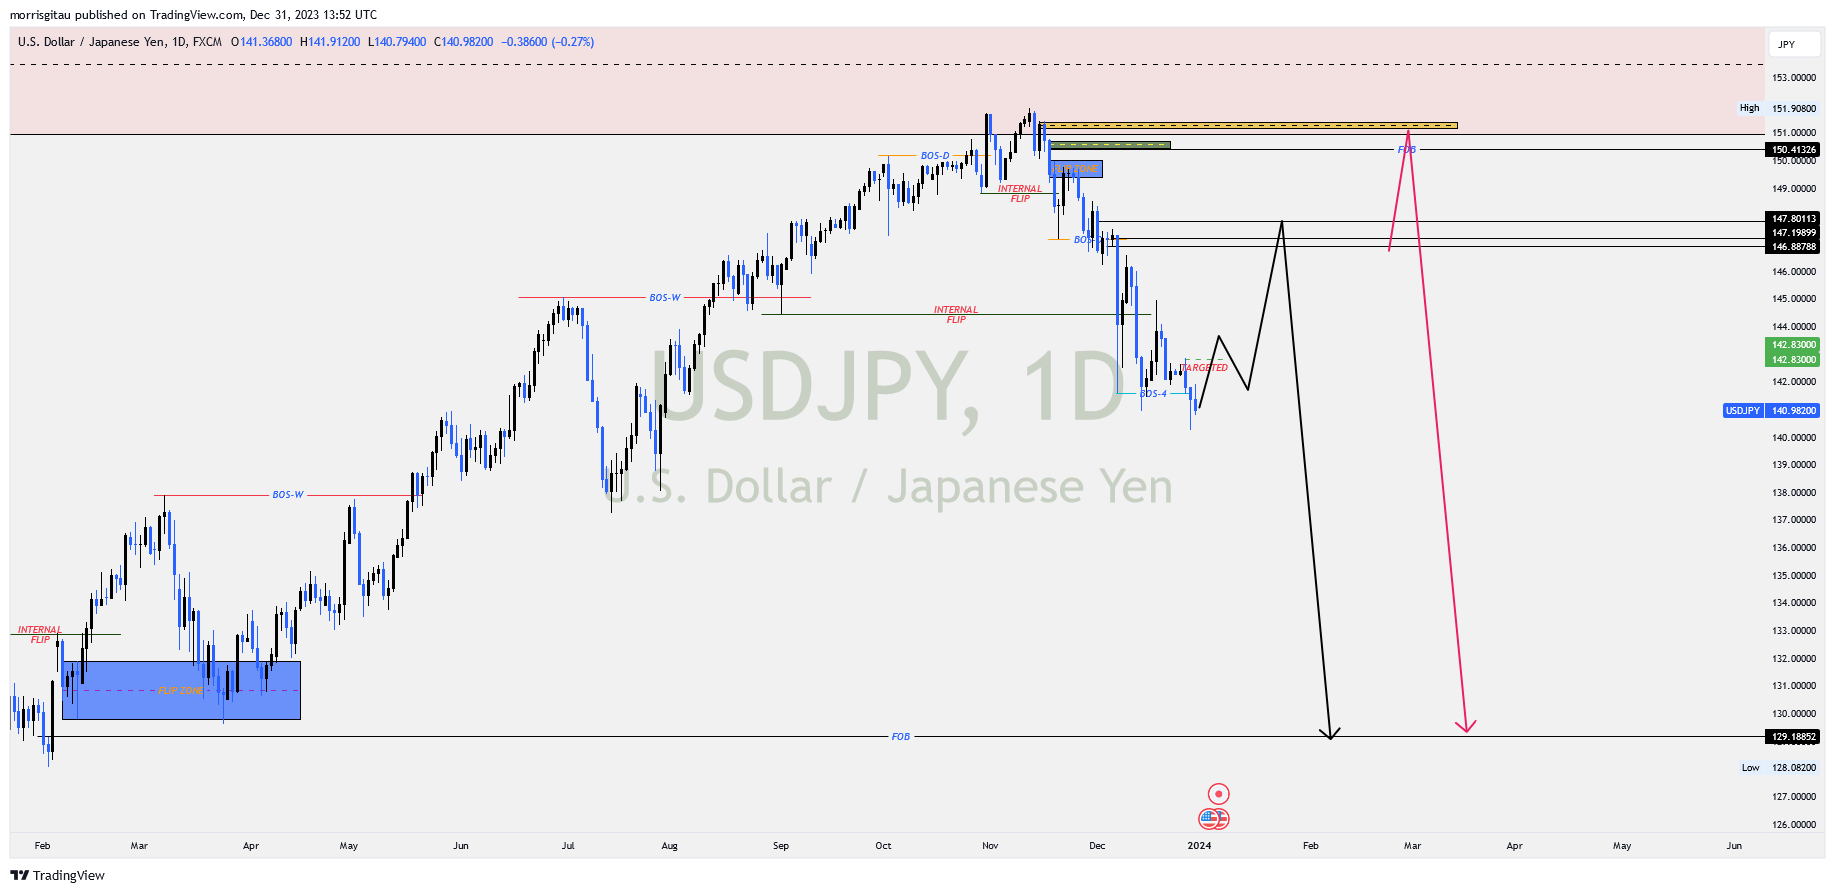
On the monthly chart, the price has completed a long term market correctio. We have seen a reaction from the monthly demand indicating order flow has shifted to bearish.
On the weekly charts, we have an internal shift in order flow and a correction that is complete confirming our long-term bearish outlook.
On the daily charts we anticipate a correction to mitigate the 146-147 region, there is a possibility the market might go higher so we will wait for confirmation for either buy limit targeting 146-147 or sell limit from the same region or higher.
USDJPY CHART
GBPCHF
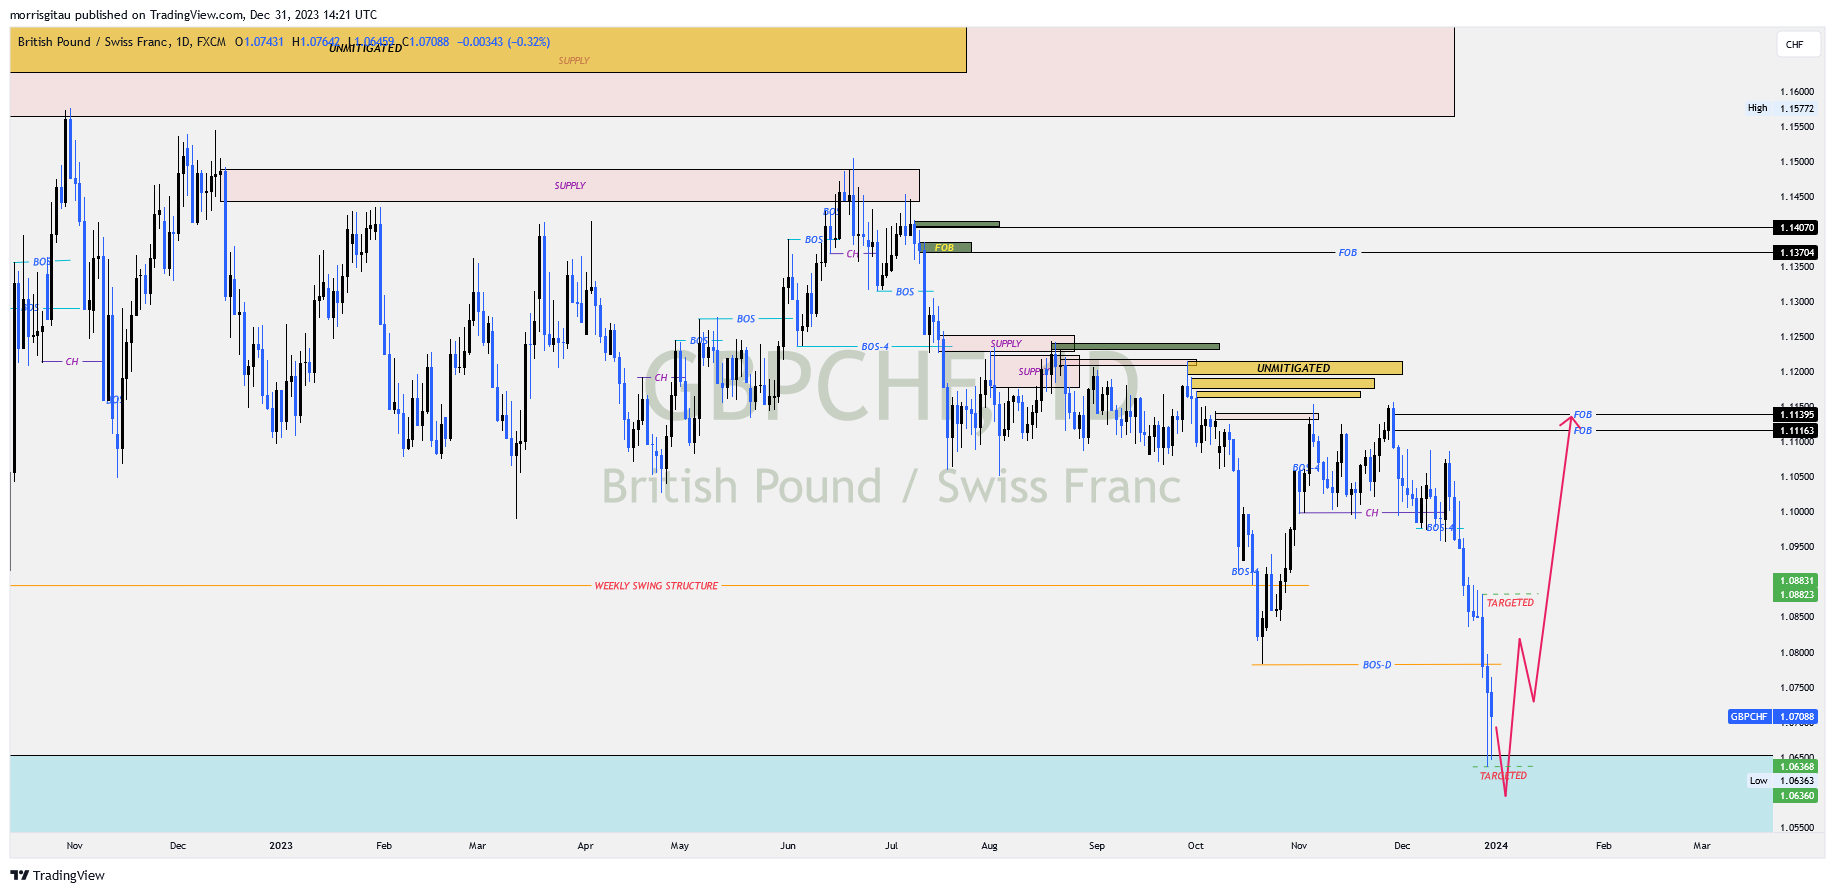
Cross Swiss Franc (CHF) pairs remained subdued for the better part of 2023. Towards the close of the year we saw signs of recovery though it was short lived. On the monthly chats, we have a break of structure, consequently, we are yet mitigate the supply at 1.20, that informs our bearish bias.
On the 4 hour chart, we are yet to get a clear confirmation though we anticipate the price will break lower before reversing to the projected upside of 1.11 -1.13
GBPCHF CHART
GBPCAD
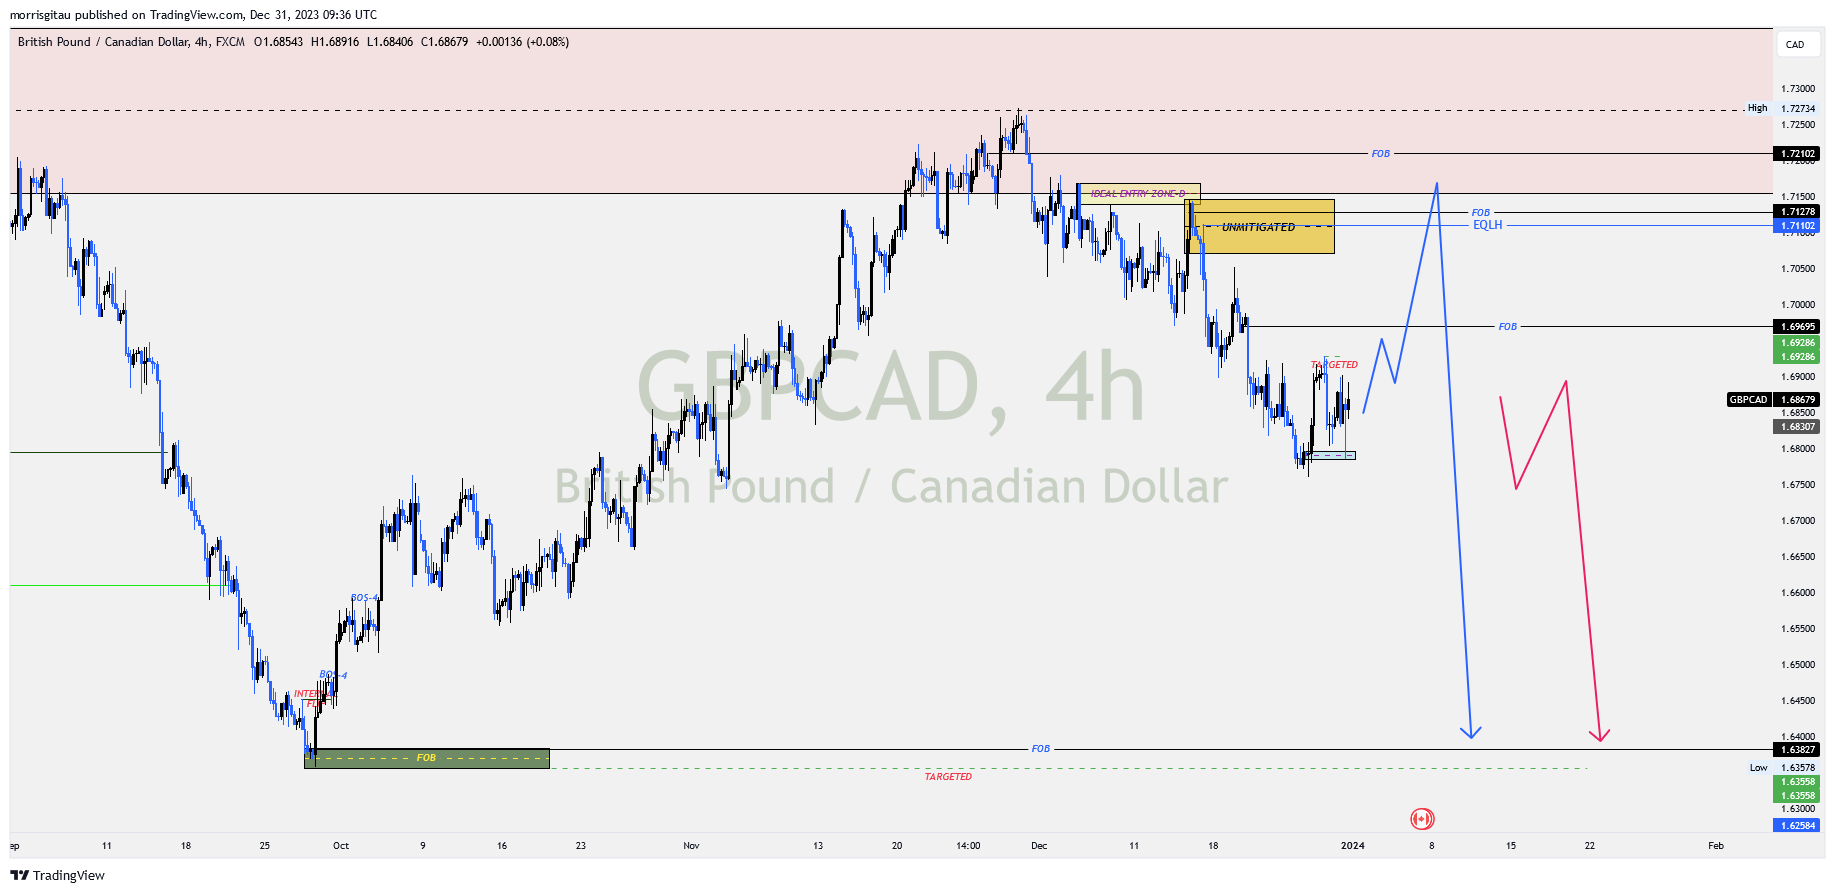
A resurgent British pound and declining oil prices have resulted to a strong bullish move on the monthly chart that has mitigated a previous supply.
Presently still on the monthly chart we are registering strong bearish orderflow.
Presently on the 4 hour chart we are awaiting confirmation, a bearish continuation or a minor bullish correction targeting the unmitigated supply above before a bearish continuation.
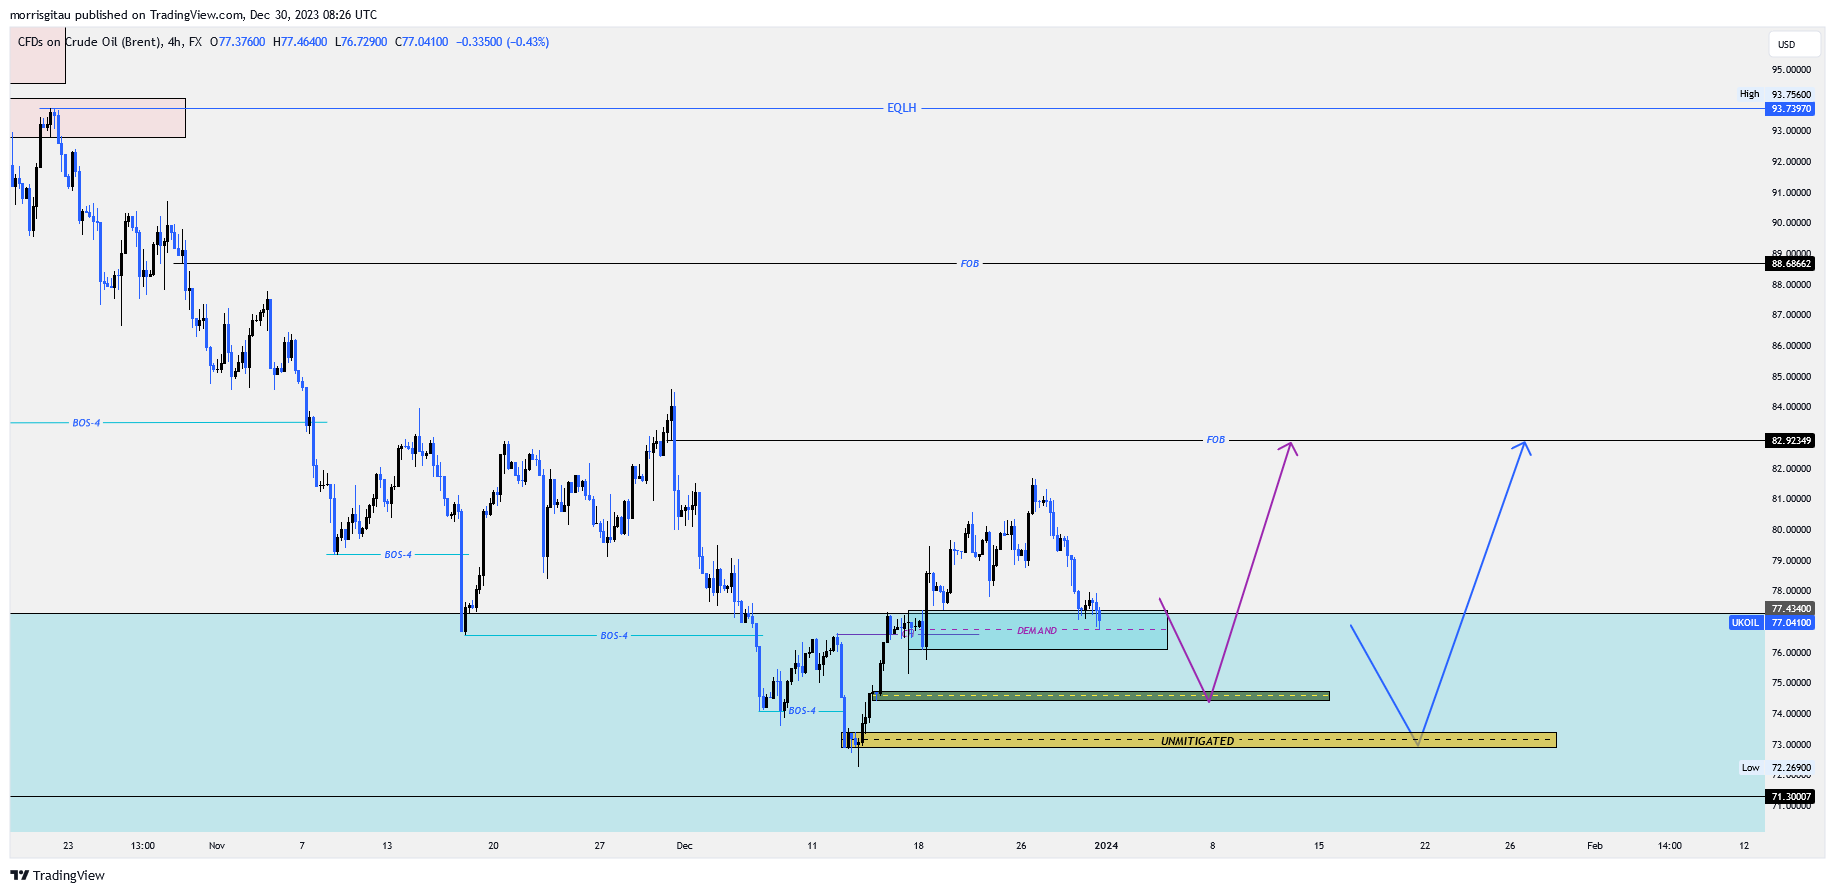
On the monthly charts, we have a consolidation around a strong demand level. On the weekly timeframe, we do not have a clear direction though the market seems to be pushing higher to mitigate inefficiencies at the 107-115 levels.
Dropping down to the 4-hour chart, we have a bullish bias targeting 77-90 levels. Change of character plus flip zones in addition to multiple breaks of structures inform our bullish bias. Once we cross into 2024, we expect a further slide down to the unmitigated zones in yellow or green to collect buy orders before pushing higher. Oil is positively correlated with the Canadian dollar (cad), such that an rise in oil prices boosts CAD and the reverse is true. Moving forward we are also seeking cross CAD set ups.
UK OILUS OIL
Our analysis is based on smart money concepts particularly supply and demand. We practice a conservative approach to forex trading that ensures risk minimization.
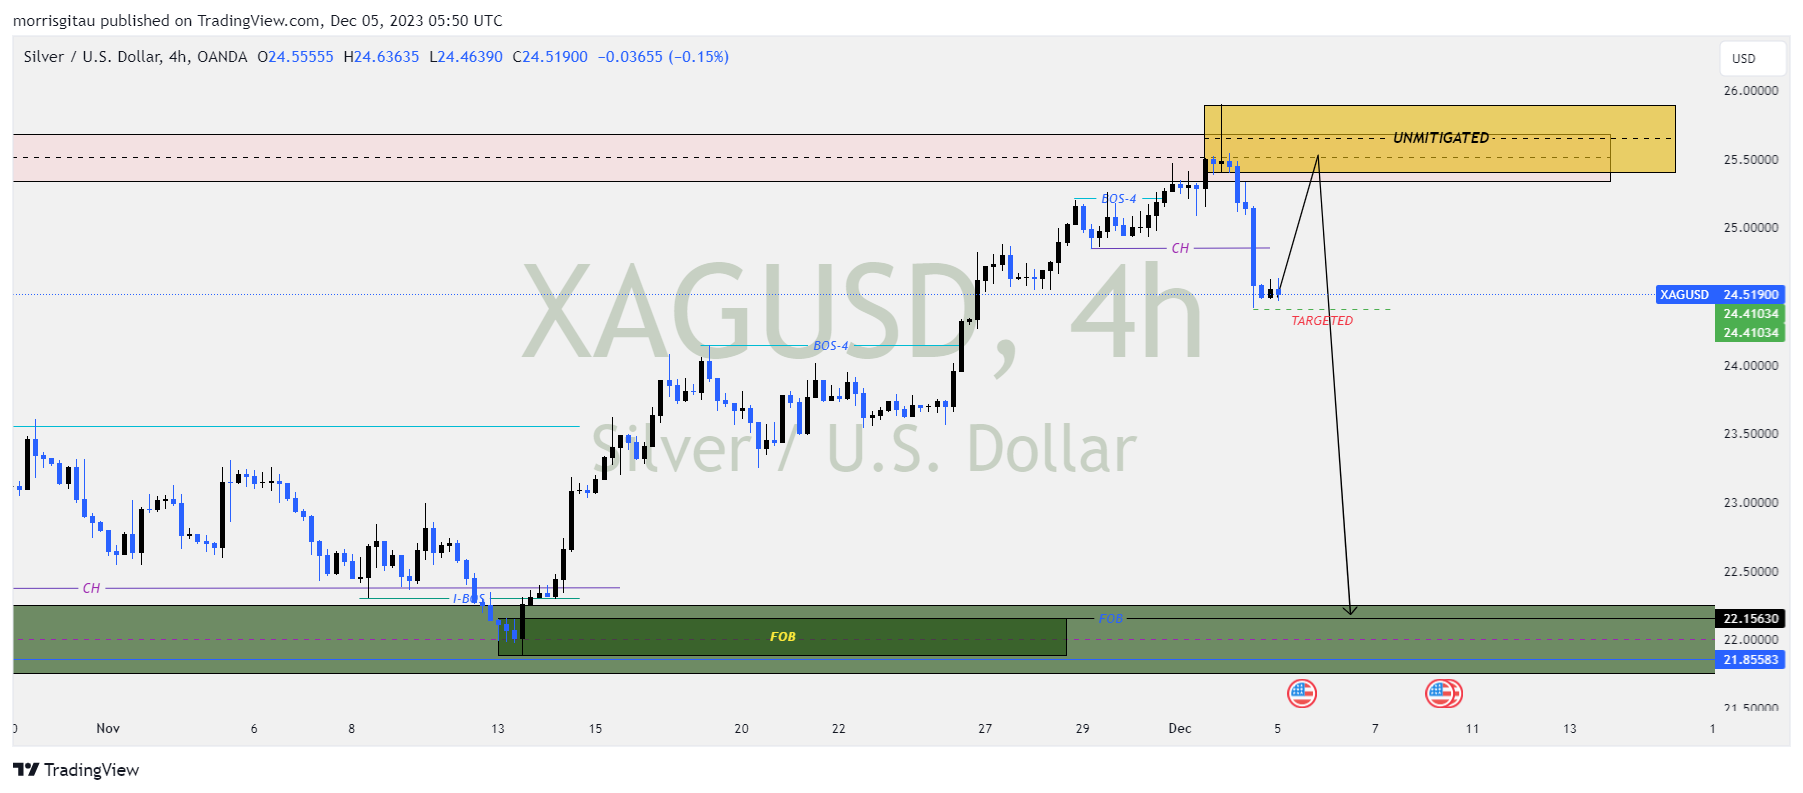
On the weekly timeframe, we have bearish trend with minor corrections. Presently, we are in the tail end of a bullish correction. On the 4 hour charts we have registered a change of character signaling a reversal of trend is in the horizon.
XAGUSD CHART
EURUSD
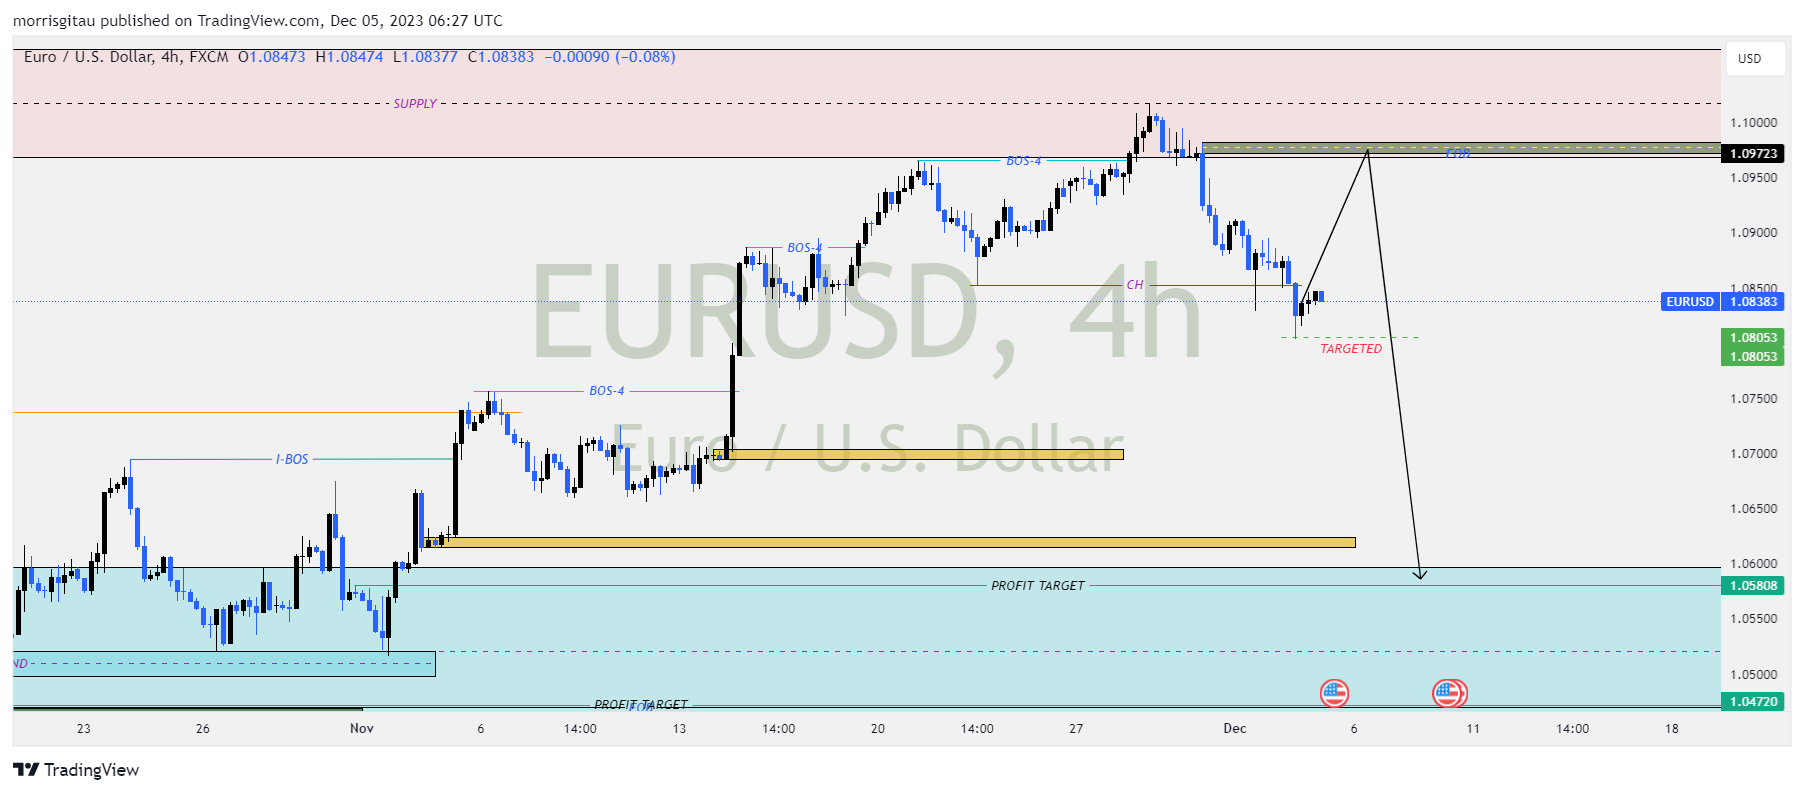
For the better part of 2023, we have maintained a bullish bias. However, on the weekly timeframe we have confirmed reversal to the downside to correct inefficiencies at 1.00 price handle. The bullish correction has come to an end. On the 4 hour chart we have a change of character confirming the reversal. Once we have a second confirmation, we can trade this pair targeting the weekly low of 1.047 price handle.
EURUSD CHART
EURCAD
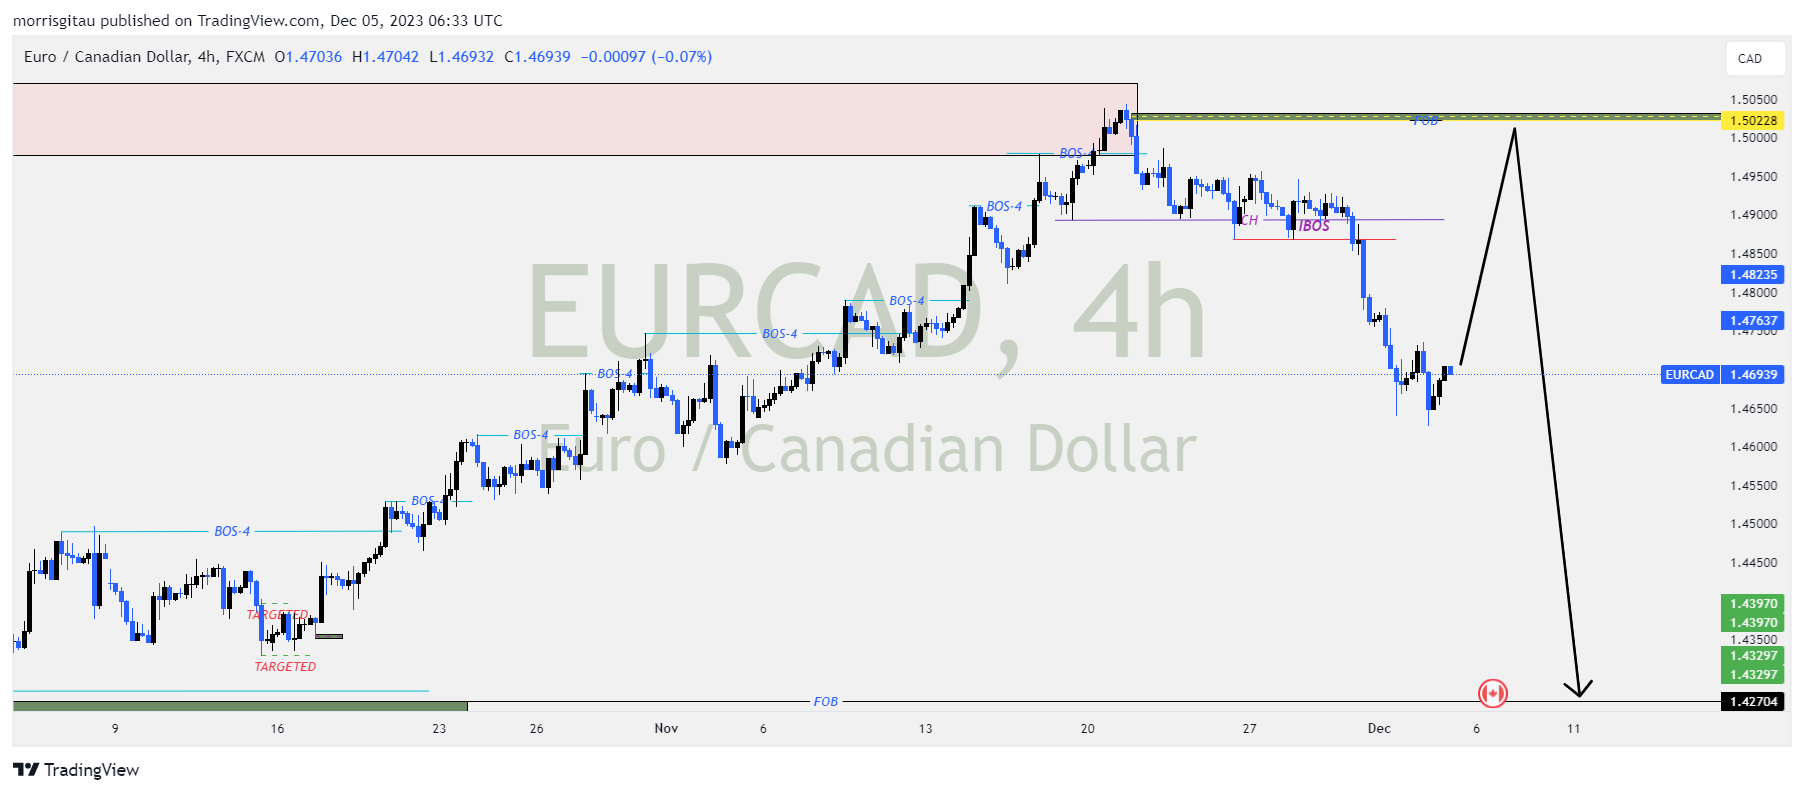
On the monthly timeframe, we have a strong bullish momentum. The bullish momentum has created inefficiencies that the market seeks to correct. On the daily charts, we have a new low and lower high formed indicating signs of a bearish correction. On the 4 hour chart we have a change of character confirming a bearish set up. Once we have a minor bullish correction, we will seek sell limit orders.
EURCAD CHART
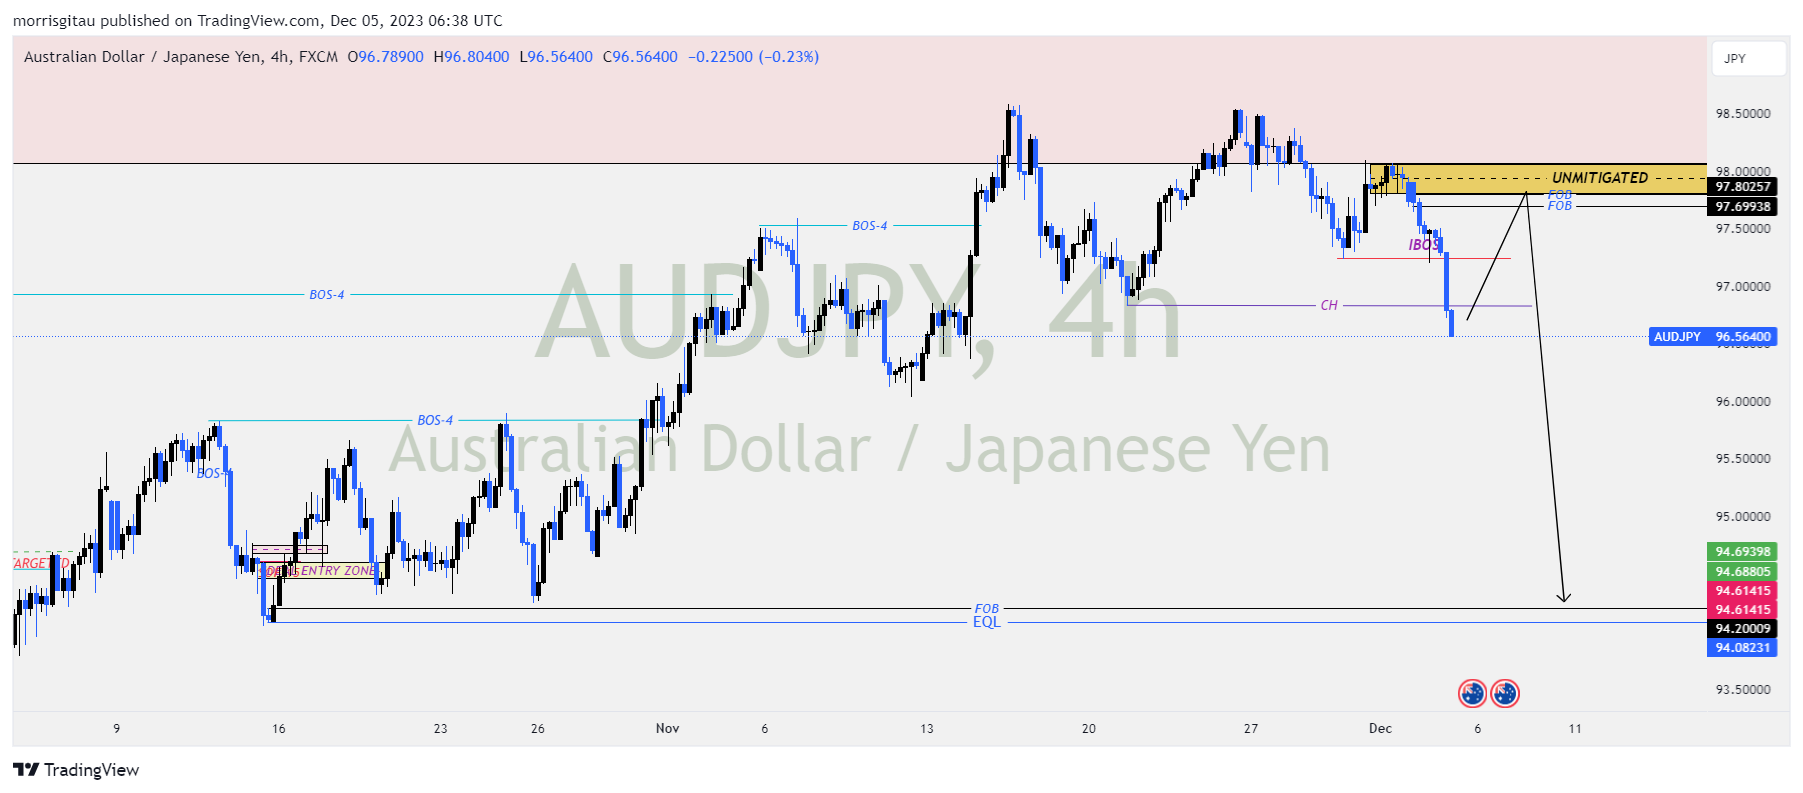
AUDJPY
The Japanese Yen has had a lackluster performance in 2023. Talk of Bank of Japan intervention has not slowed the bearish trend. There are signs of reversal of the Yen across. On the 4 hour chart, we have an internal and external break of structure confirming a bearish bias.
AUDJPY CHART
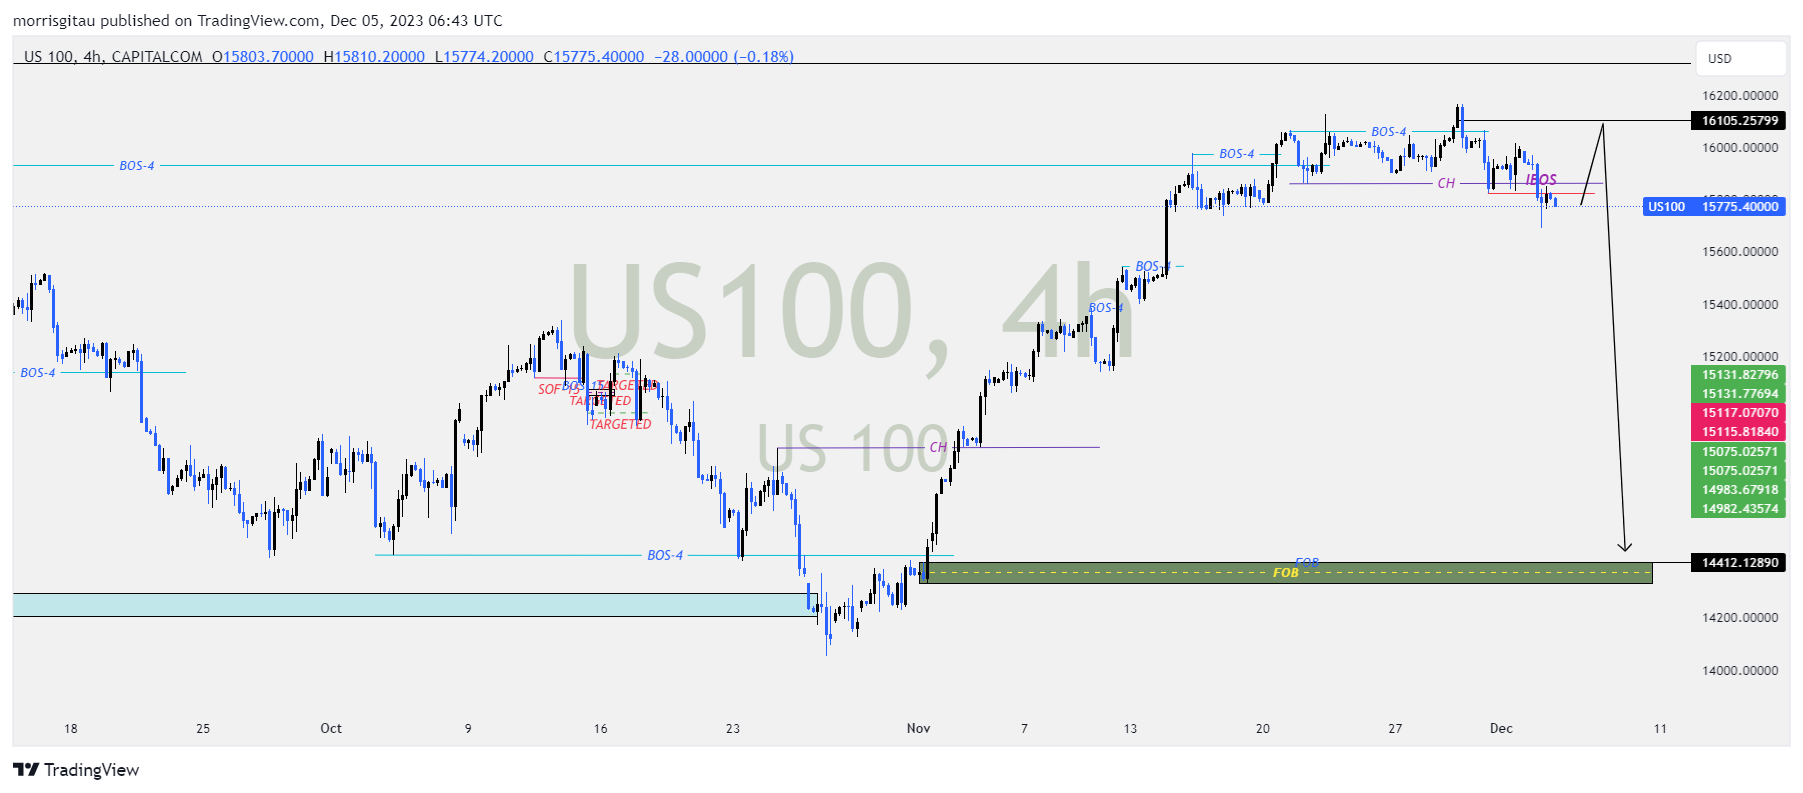
US 100
US100 and US Dollar have a negative correlation, when one rises, the other falls. In the last one month, the US Dollar index, DXY has been in bearish correction while the US 100 has been in bullish correction. The correction seems to have come to an end with the US100 registering both internal and external breaks. We anticipate a minor correction to activate our sell set ups targeting the inefficiency on the downside.
As the year draws to a close, we are witnessing major shifts in structure across multiple pairs. Low liquidity is a prevailing phenomenon in Q4, therefore, exercise caution.
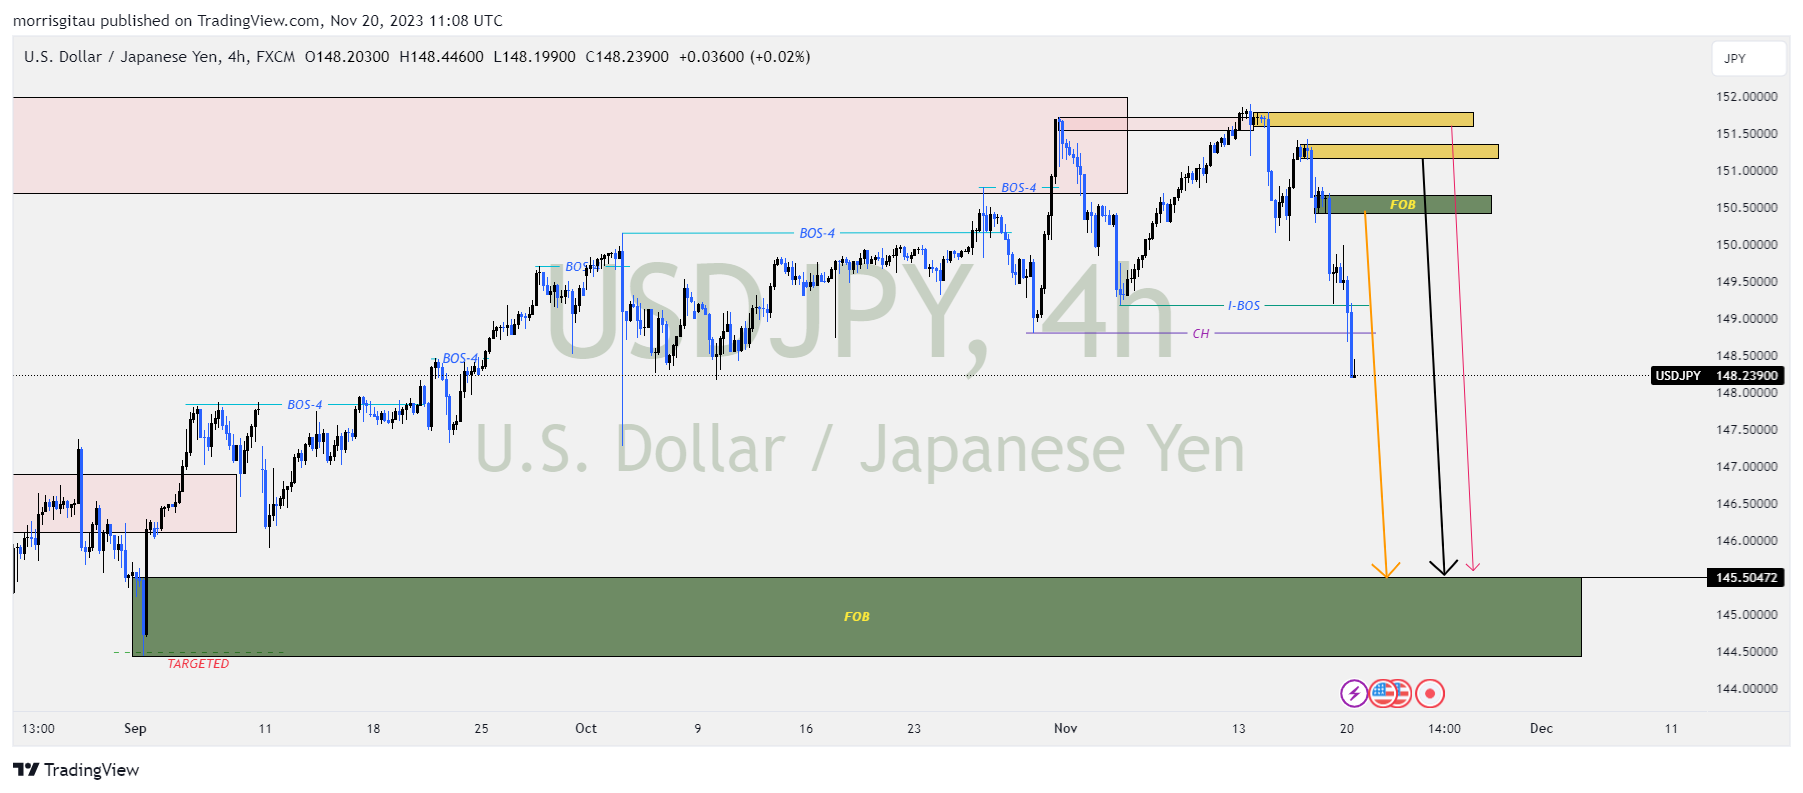
USDJPY
Finally, there are signs of shift in market structure from bullish to bearish. On the 4 hour chart, we have an internal break of structure and a change of character. This informs our bearish set up. On the retracement, we shall seek sell limit order(s) at either unmitigated or fresh supply.
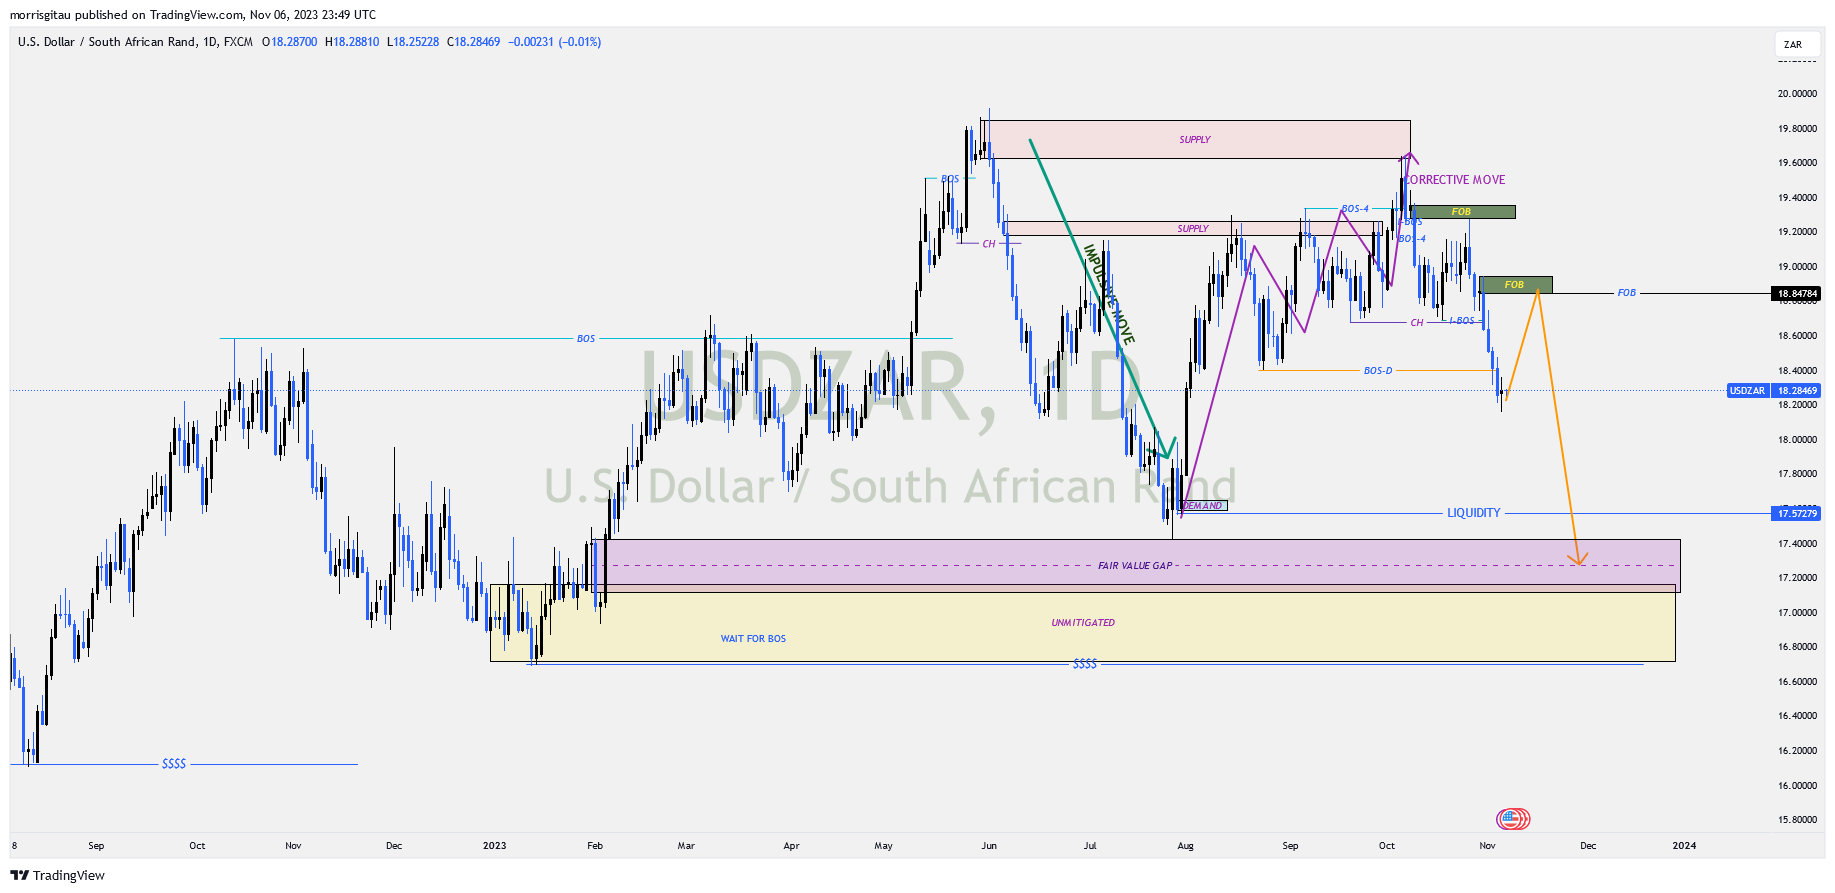
In Q2 of 2023 we saw an impulsive bearish move. Presently we have completed a bullish correction that has shifted order flow from bullish to bearish. We have a break of key structure on the daily time frame. Presently we are awaiting a minor bullish correction targeting the FOB then resume the bearish order flow.
USDZAR SHORT SET UP
USDMXN
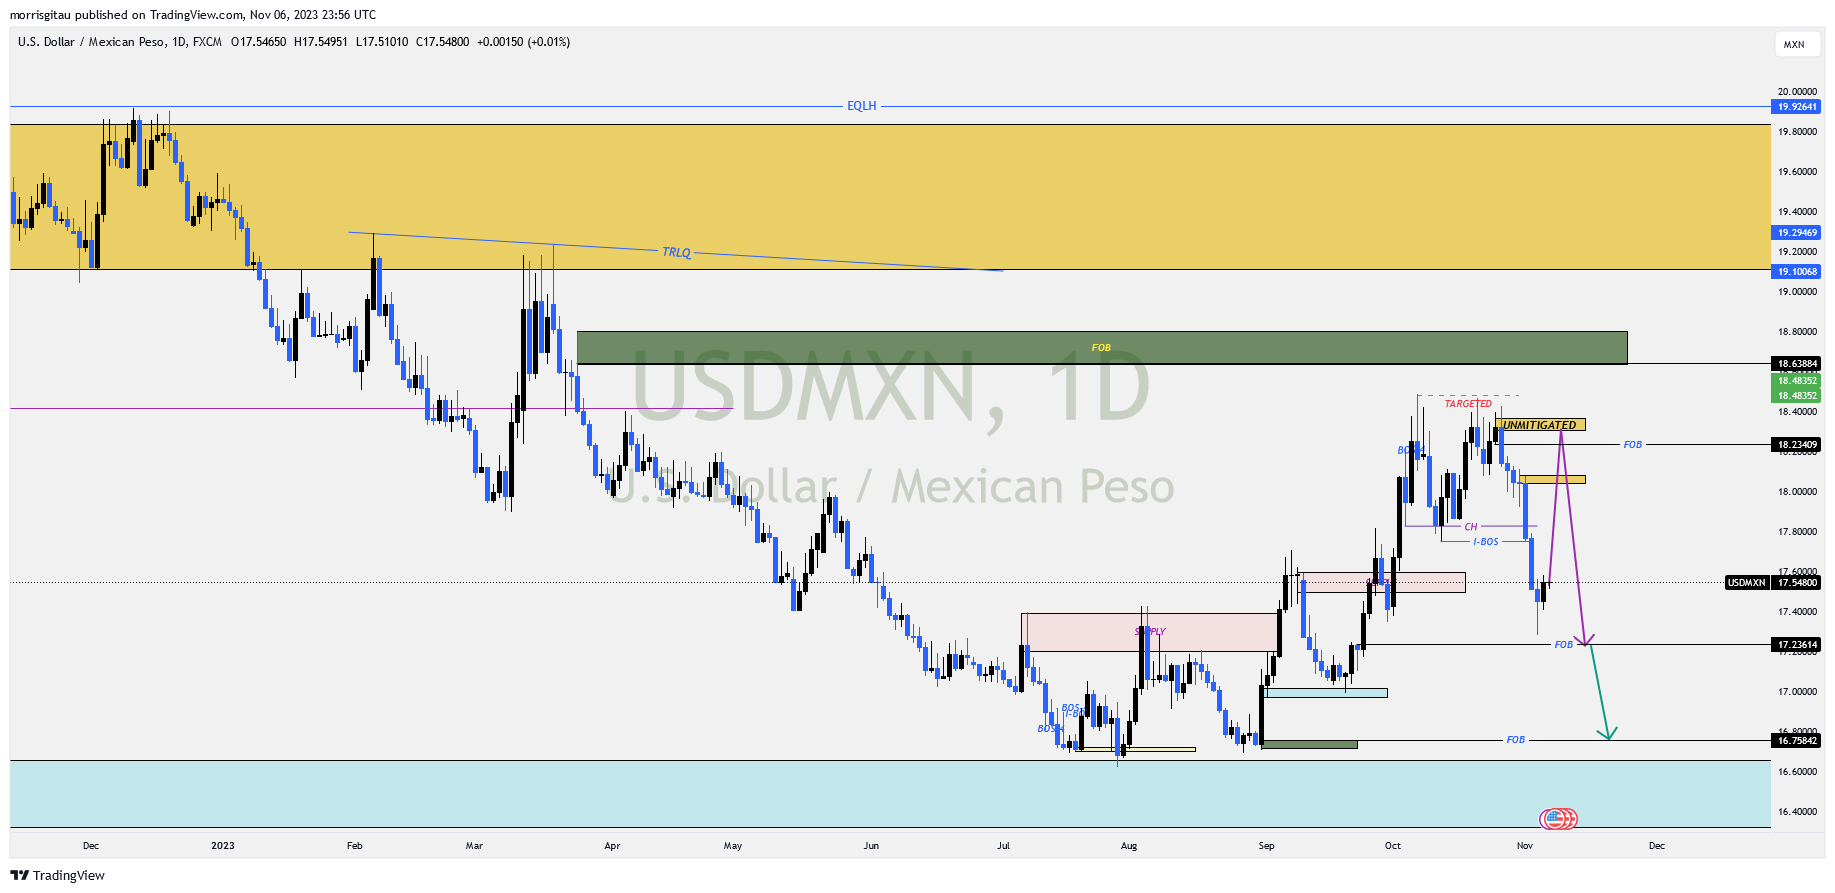
Presently we are in a profit taking season against the dollar that has sponsored a bearish outlook. We have a change of character and break of structure that informs our bearish outlook targeting the unmitigated demand at 16.76 price handle. We are anticipating activation of our sell li it orders at 18 price handle.
USDMXN SHORT SET UP
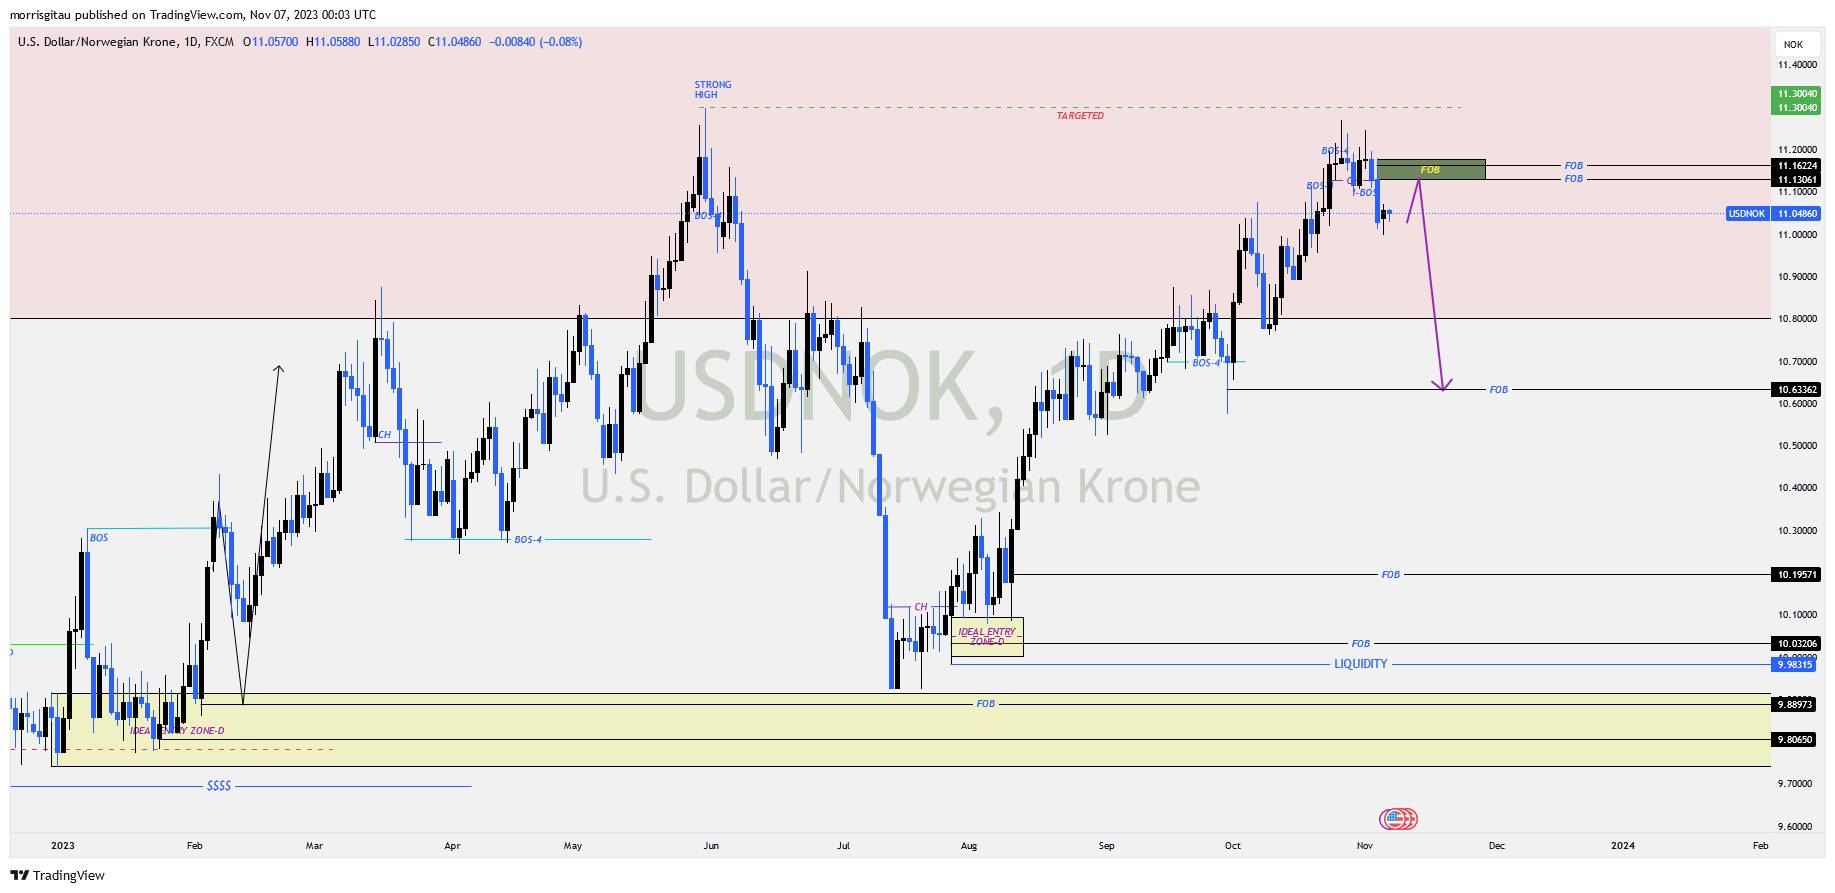
USDNOK
A failure to break the former high and a shift in orderflow from bullish to bearish informs our sell limit set ups. Presently we have a change of character and a break of structure. We anticipate a minor bullish correction to activate our sell limit orders at 11.16 price handle.
USDNOK SHORT SET UP
BTCUSD
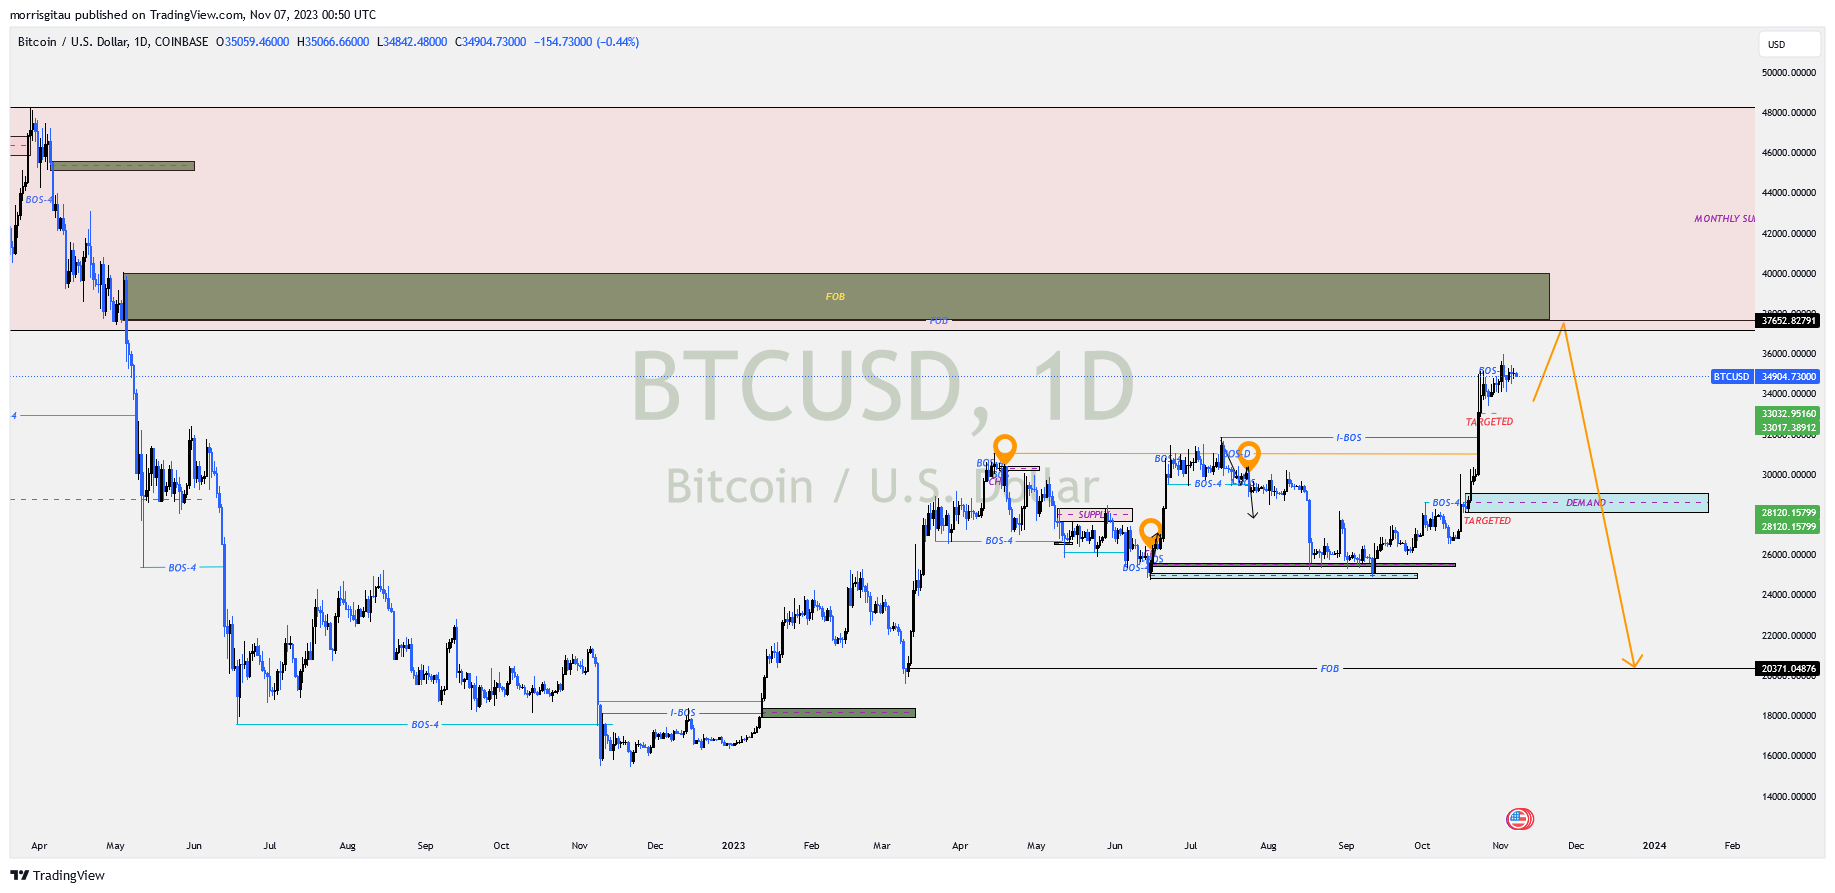
Profit taking has pushed the dollar lower across major instruments. Presently we anticipate bitcoin to gain more ground against the dollar possibly hitting the 37,000 price handle. Thereafter we shall await a shift in order flow and market structure before placing sell orders.
BTCUSD CHART
USDCAD
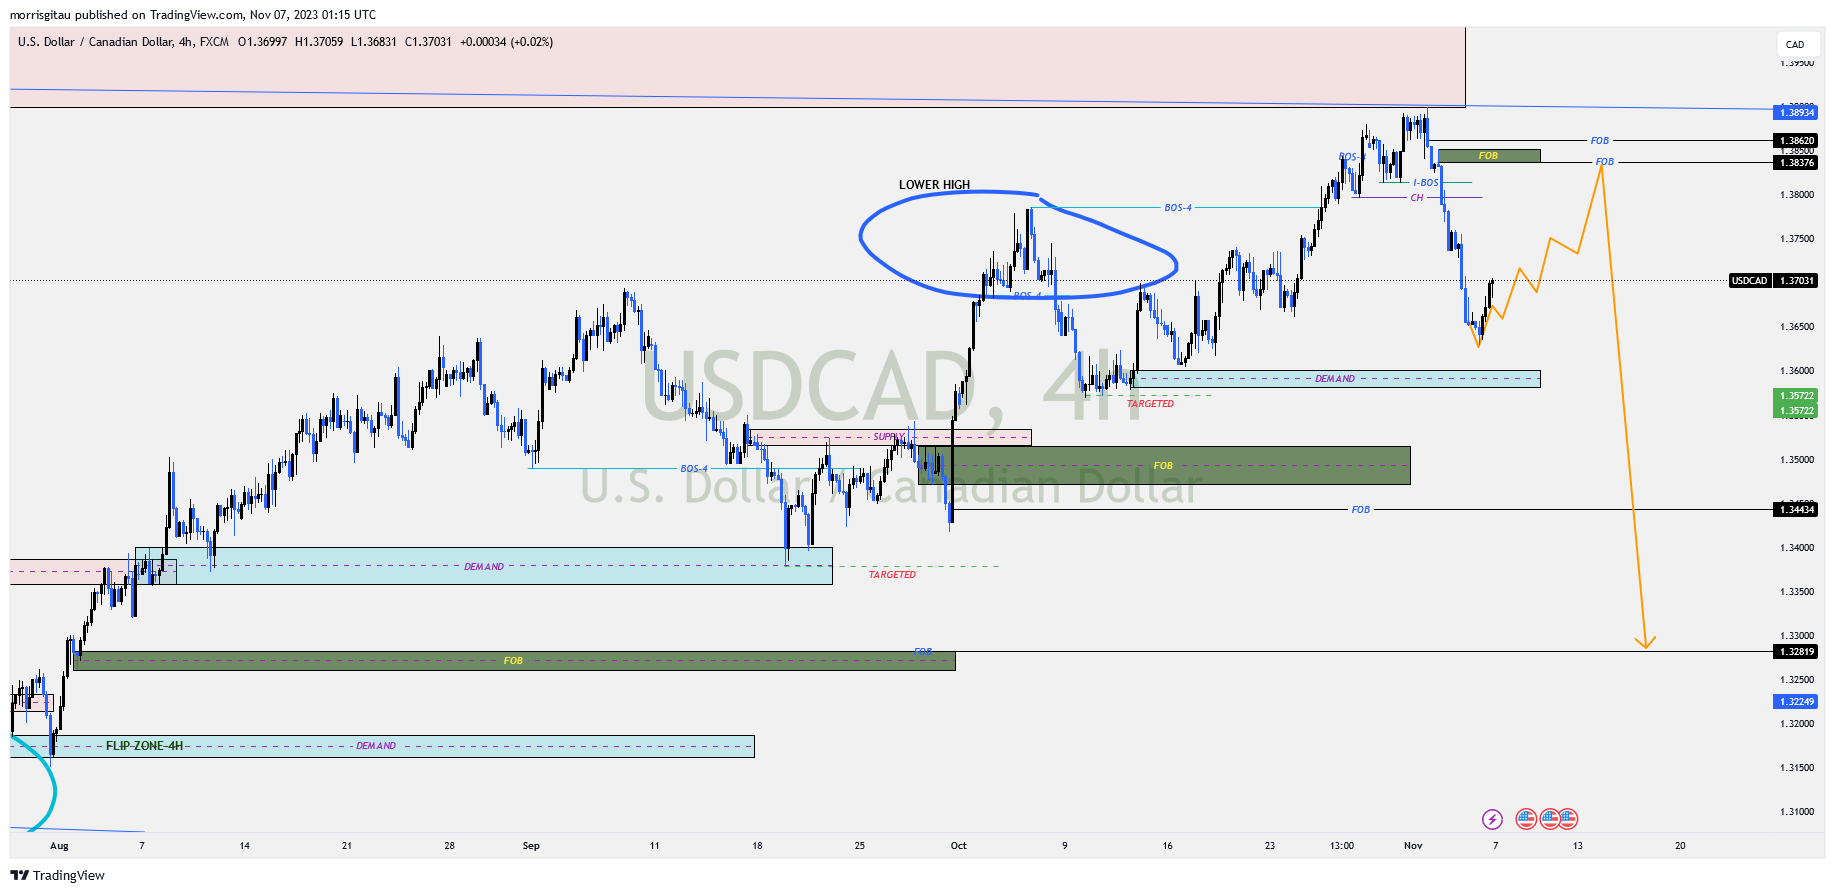
We have a change of character and an internal break of structure that informs our sell lomit order. Possible resurgence in oil prices coupled with profit taking against the dollar is expected to push the dollar lower against the Canadian dollar. We anticipate a minor bullish correction to activate our sell limit orders at 1.38376.
USDCAD SHORT SET UP
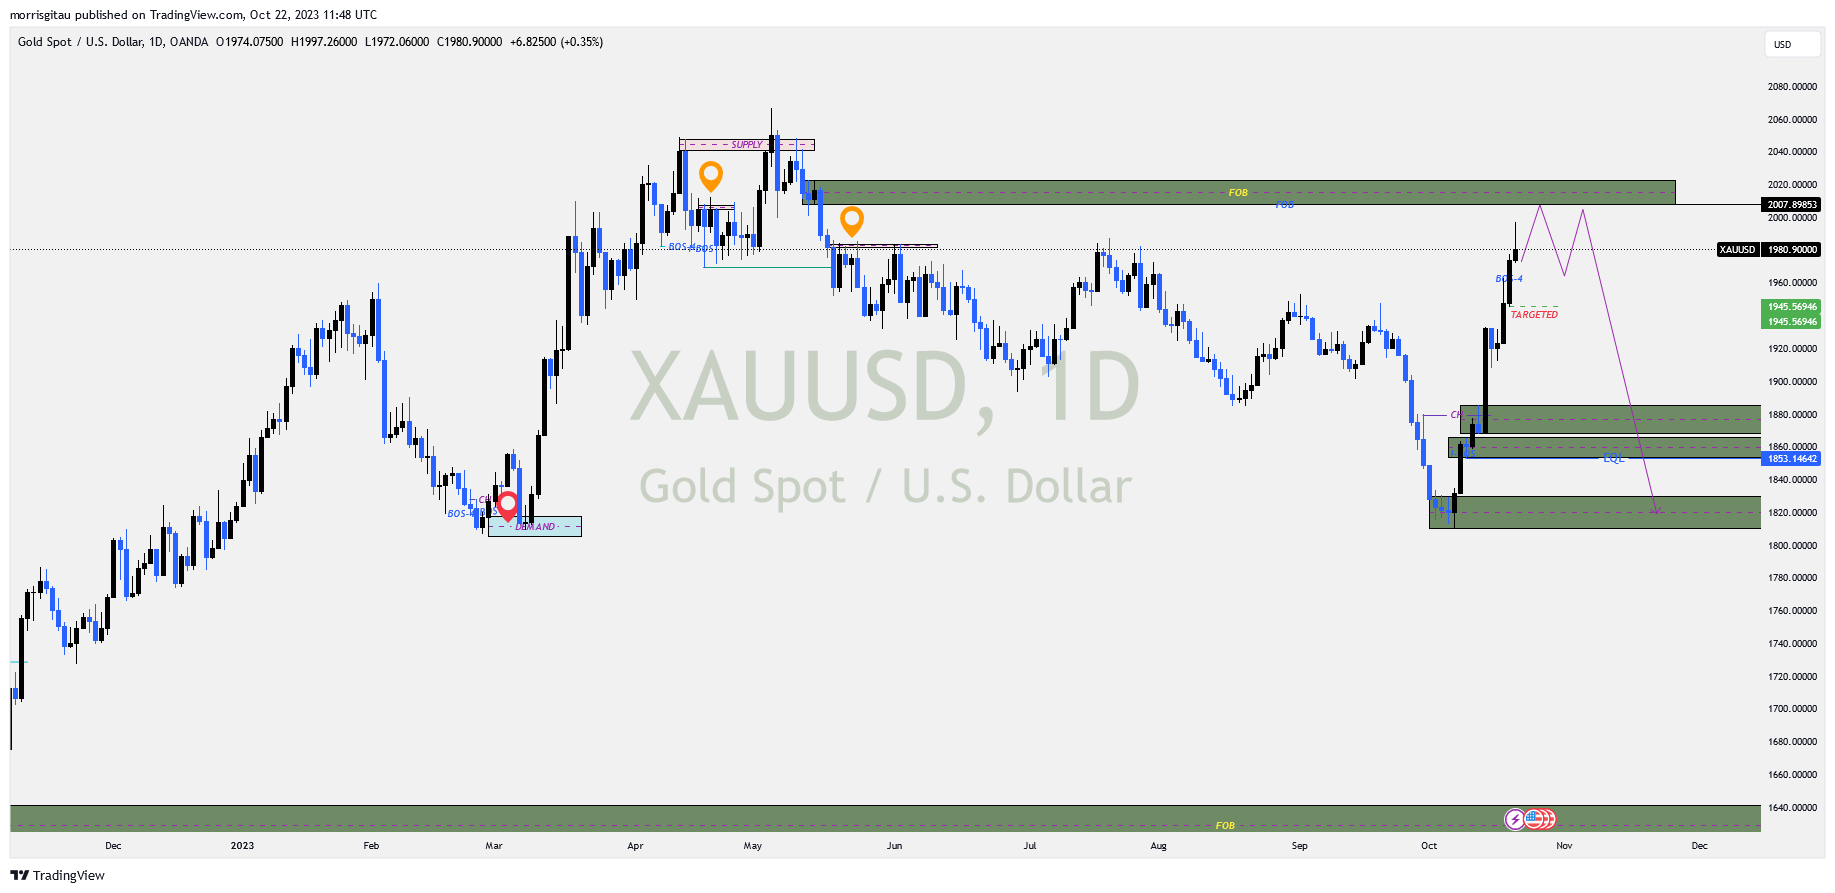
XAUUSD
On the 4-hour chart, we have a change of character and a break in internal structure. That informs our reversal/shift in market structure. We anticipate a minor bullish correction to activate our sell limit orders at the 1994 price handle.
As we draw to the close of 2023, we will be experiencing lower liquidity as the weeks go by.
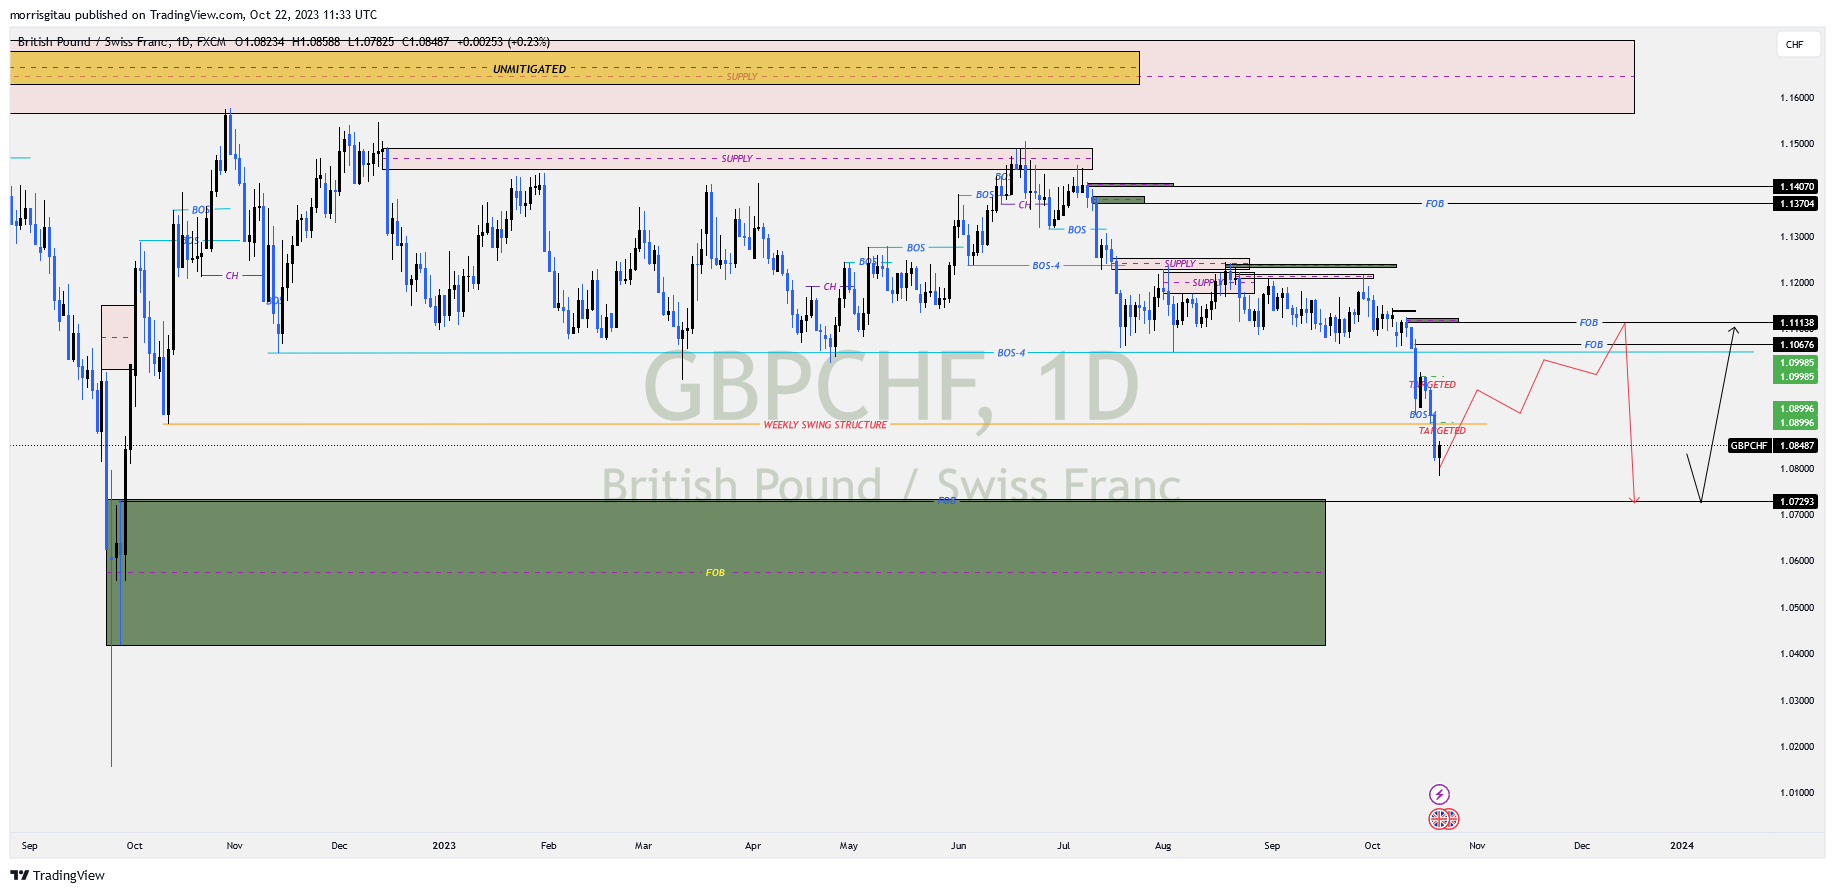
GBPCHF
Finally, we have a break of structure and break of weekly swing structure. There is a possibility of a bullish correction (red0 or bearish continuation (black). We will only trade once we have a clear set up. We do favour a bullish correction before thereafter a bearish continuation.
GBPCHF CHART
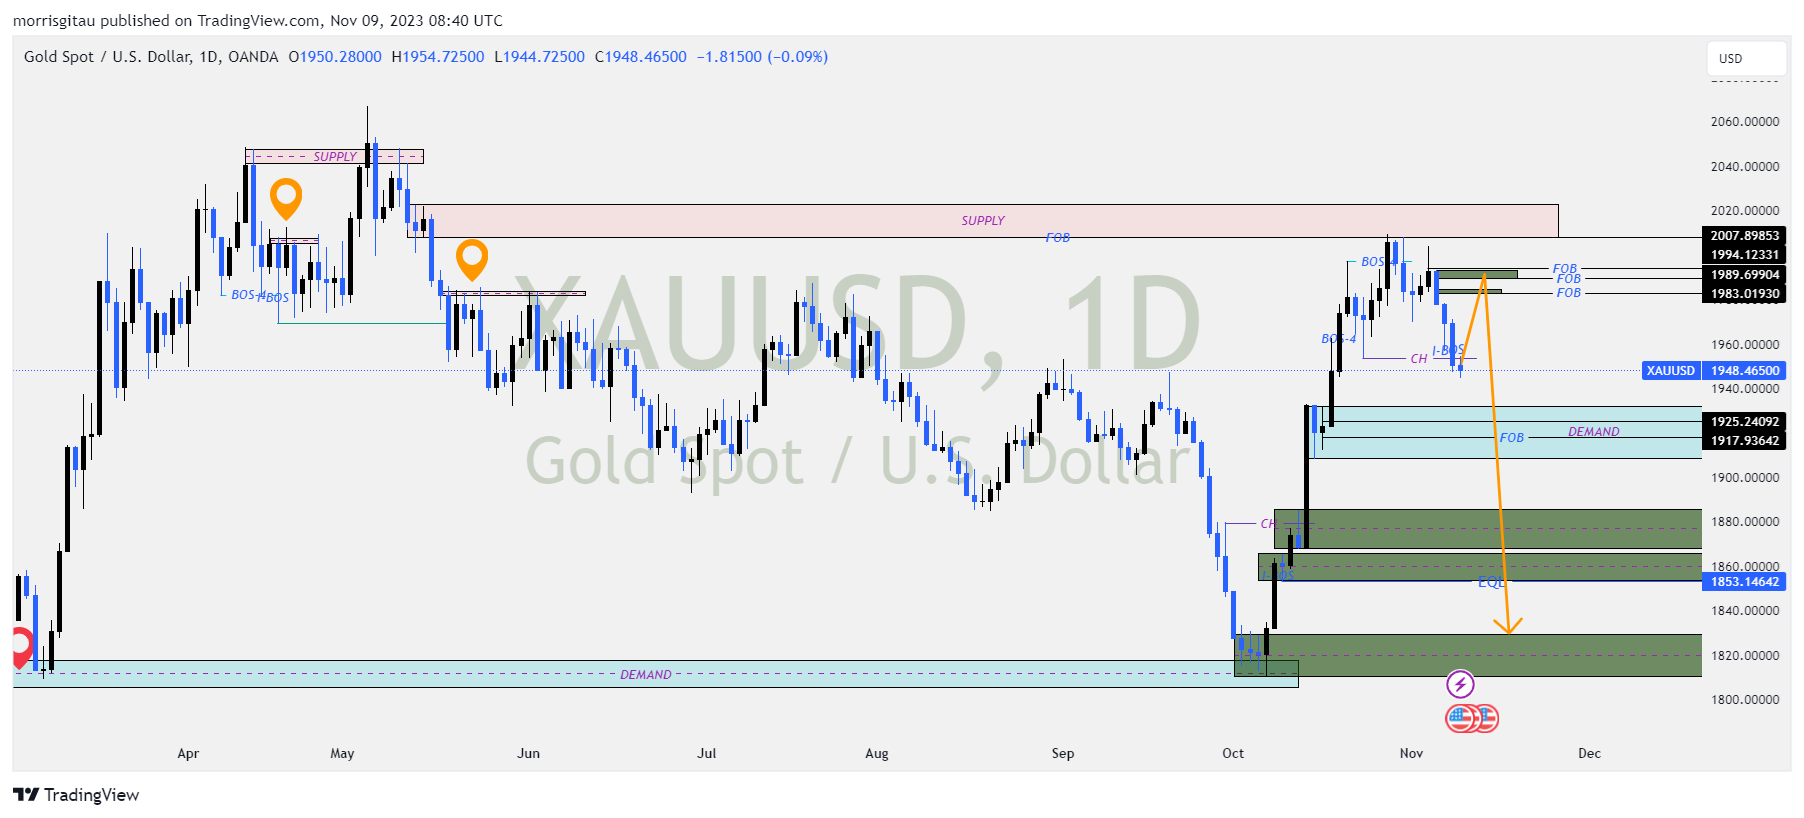
XAUUSD
As 2023 draws to a close, we are witnessing DXY profit taking. Cross USD pairs are registering a brief bullish correction and the same is evident for XAUUSD. Presently, we anticipate GOLD to mitigate the supply in green, thereafter we will look for sells or a bullish continuation.
XAUUSD CHART
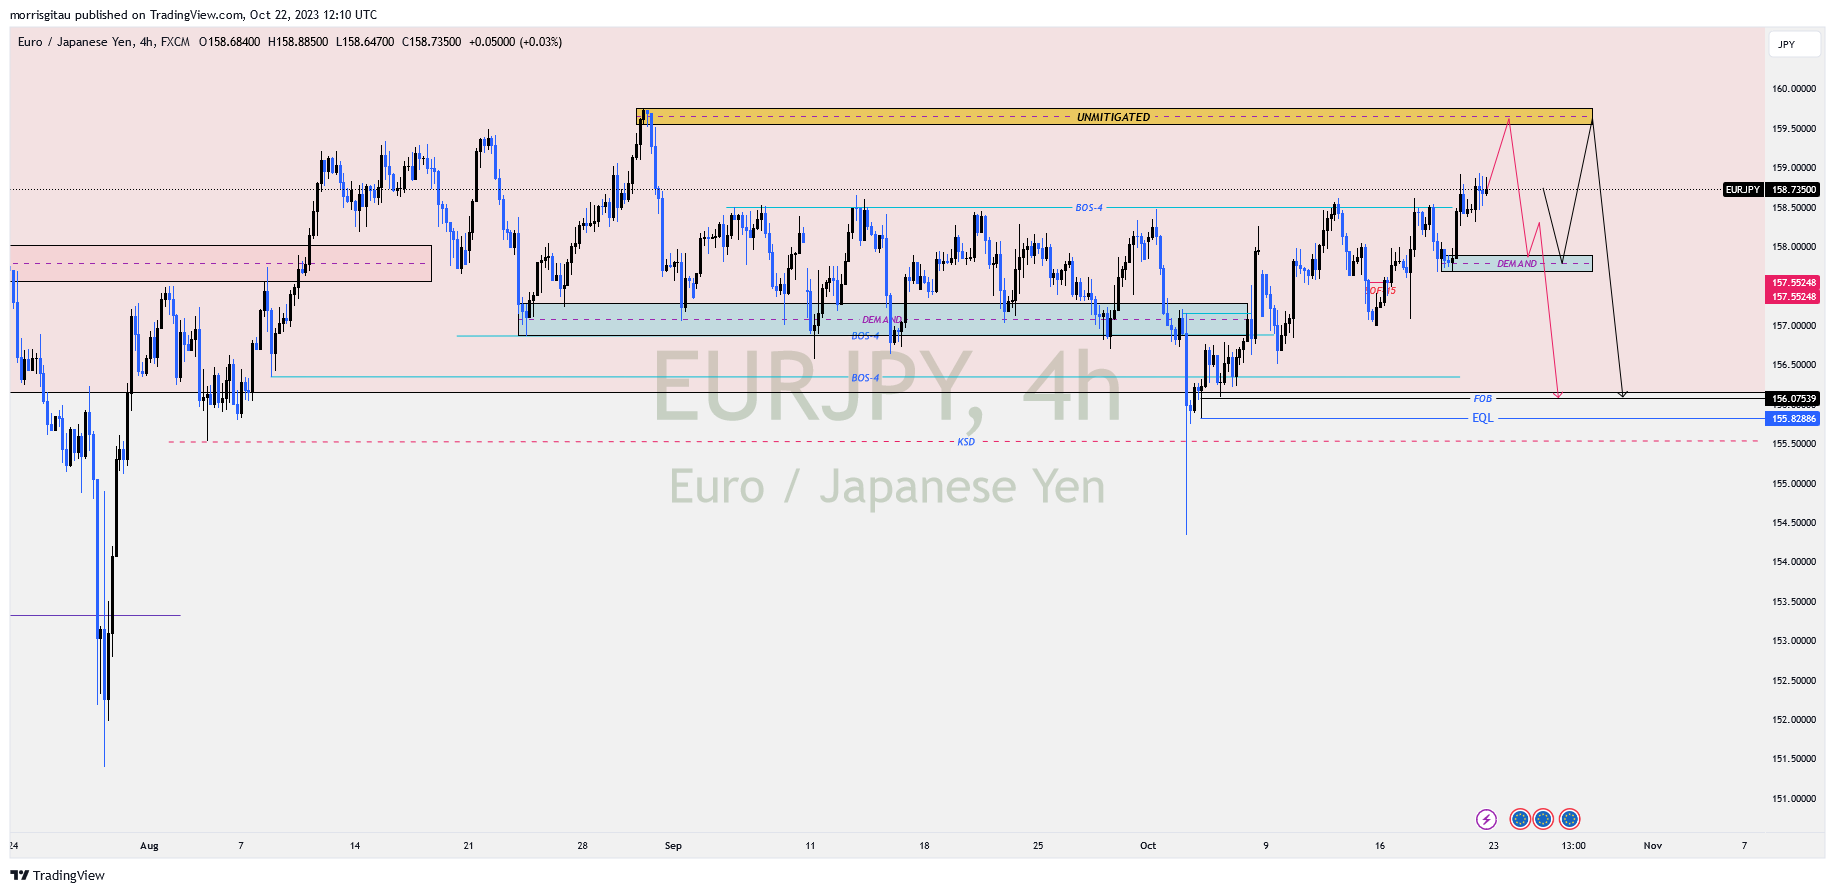
EURJPY
The Bank of Japan (BoJ) has given signs of intervention to prevent the decline in the Yen value. Presently, we have a bullish correction targeting the unmitigated region of 159. Once this region is mitigated, we will be on the look out for sells targeting the liquidity below at 155.
EURJPY CHART
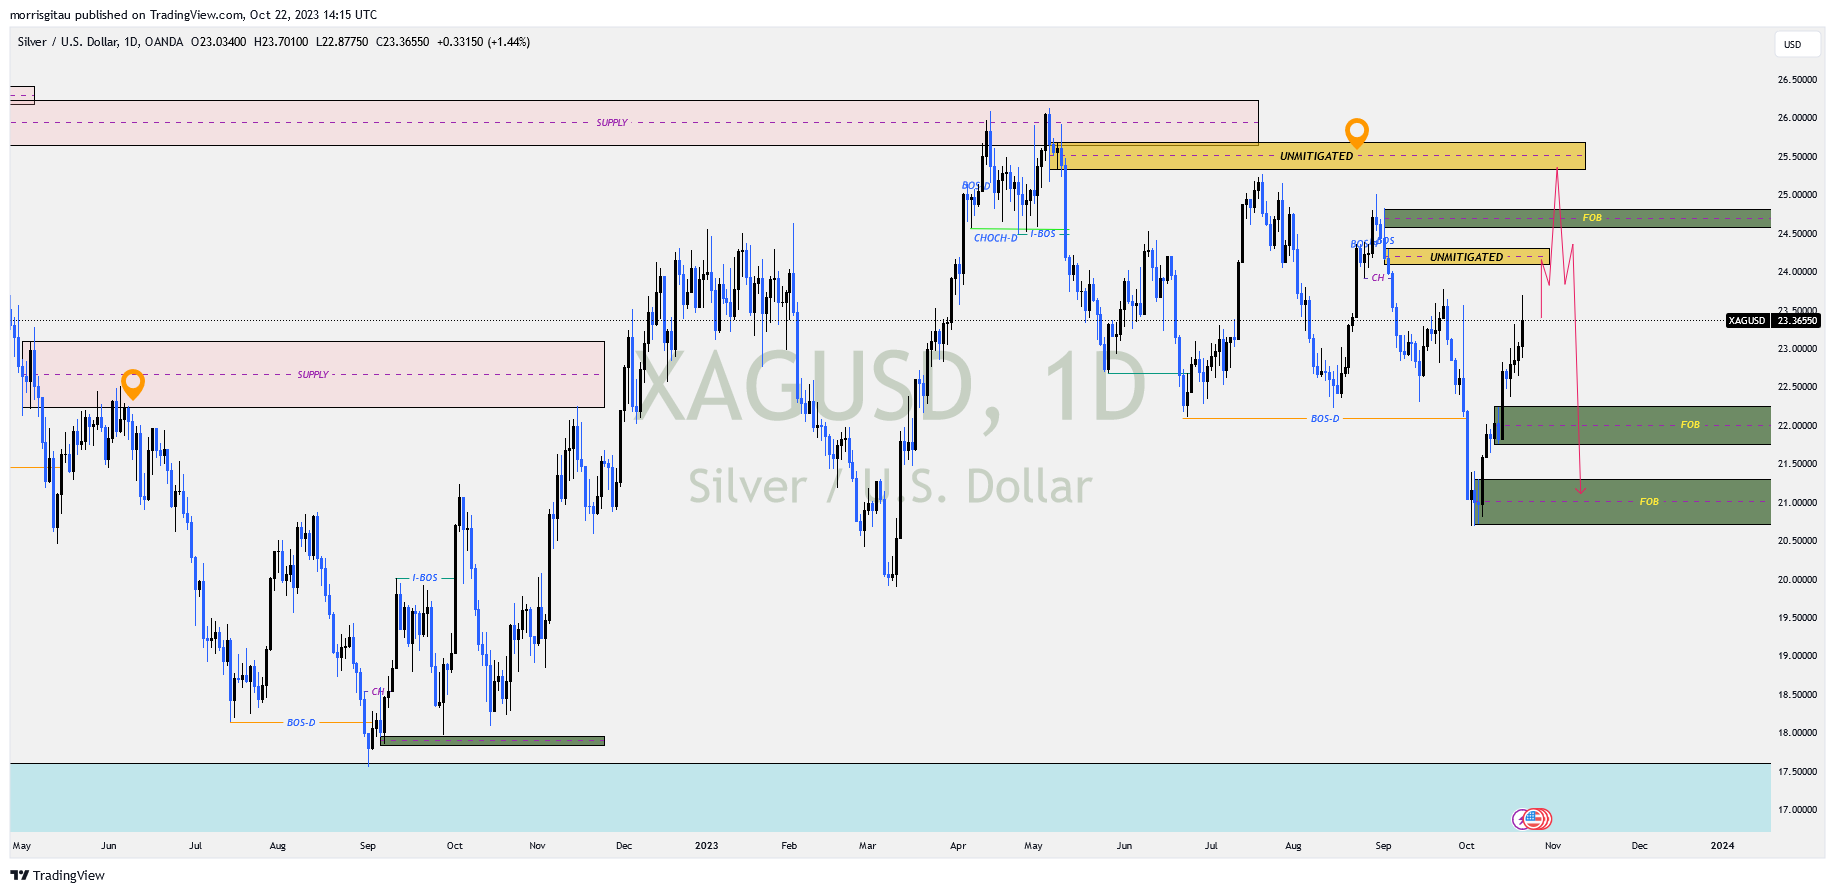
XAGUSD
Increased profit taking against DXY and the ongoing conflict between Israel and Palestine has fueled the rally in precious metals. We have broken above key levels in an attempt to mitigate the supply sitted above. We are awaiting the completion of the bullish correction thereafter we shall look for sell set ups.
XAGUSD CHART
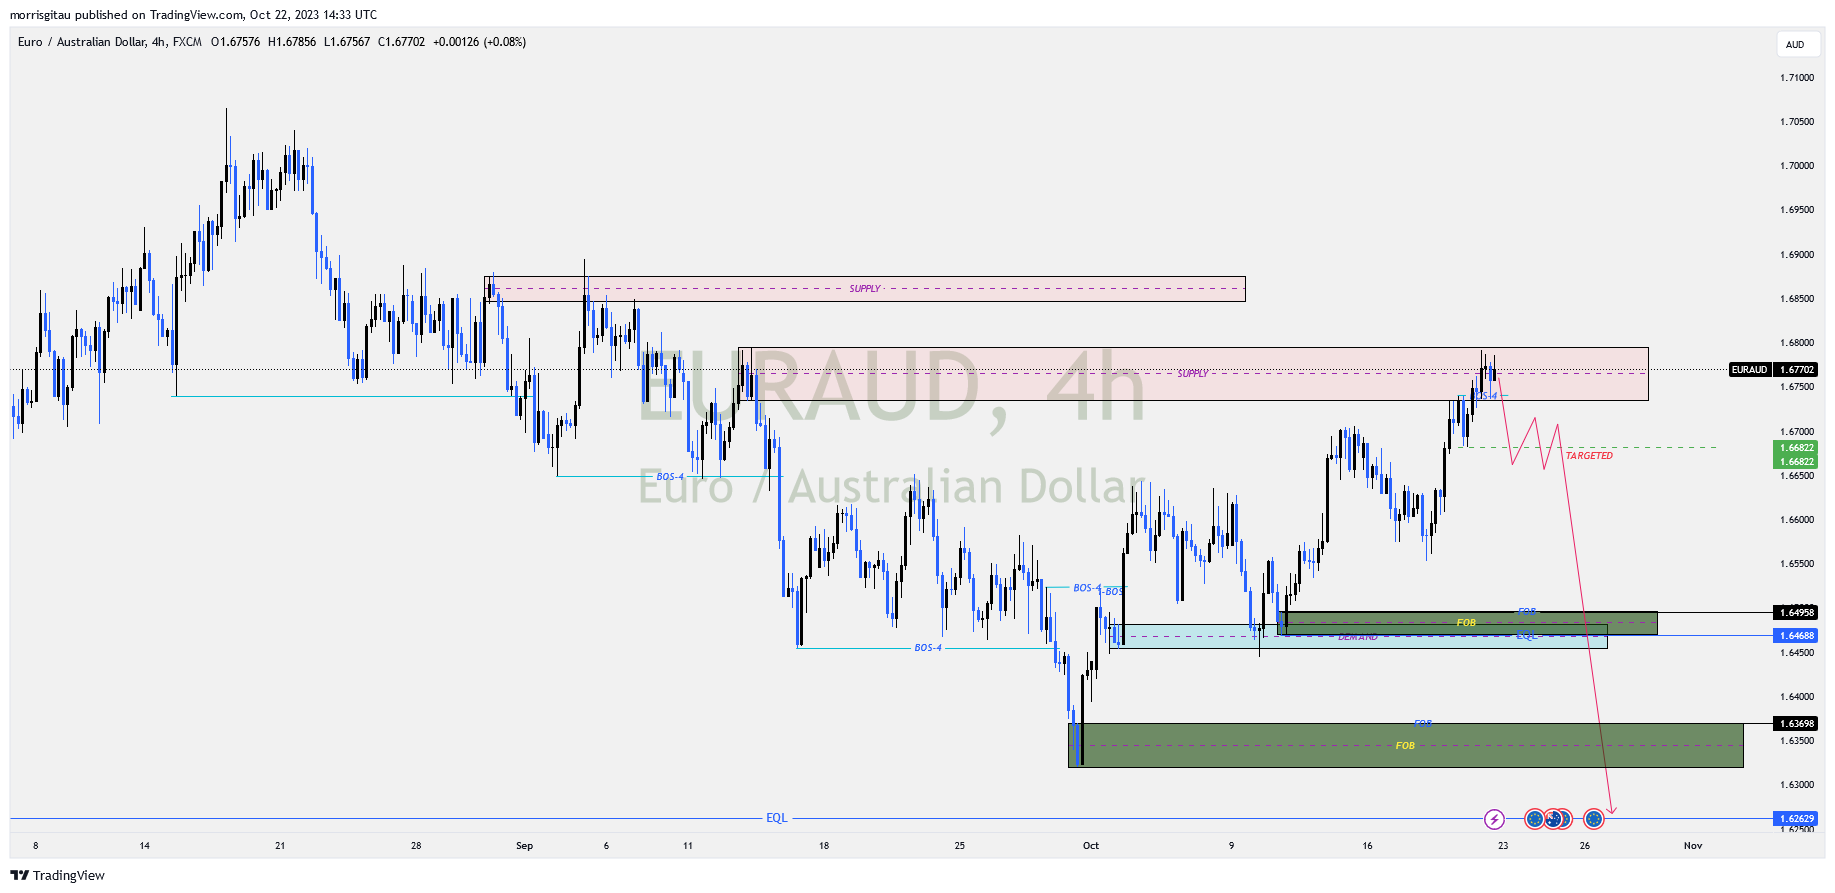
EURAUD
We are looking at a possibility of sell set ups. We are in a major bearish trend that is presently correcting itself. Should we have a break of structure, we will look for sell set ups targeting the liquidity below the lower structure.
As we draw close to the end of Q3, we have a mixed bag of bullish and bearish set ups. Below we have our forex watchlist week 39 ,2023.
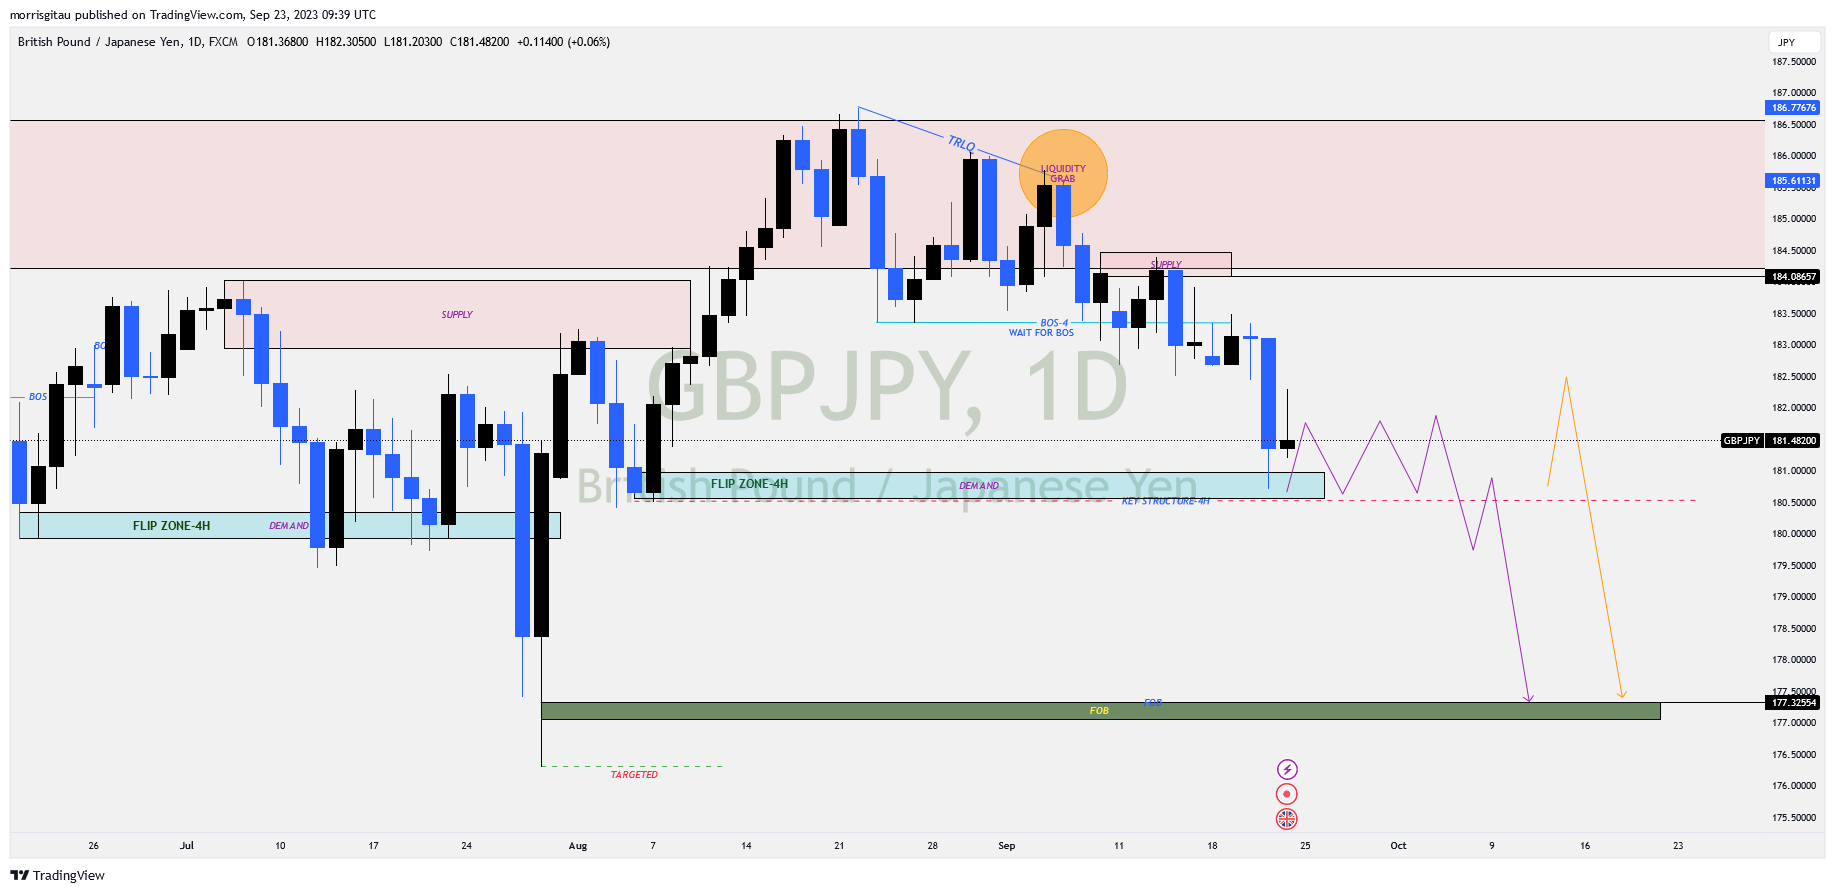
GBPJPY
GBPJPY CHART
Earlier in the month, the set up was posted in myTelegram channel. Presently, we have a mitigation in the demand zone. In the coming weeks we anticipate two possible moves. Firstly, a consolidation represented by the purple arrow. Secondly, a correction then a bearish continuation represented by the orange arrow. Our job is to wait for the market to break below then find valid sell limit set ups. Join my telegram channel for access to updated set ups.
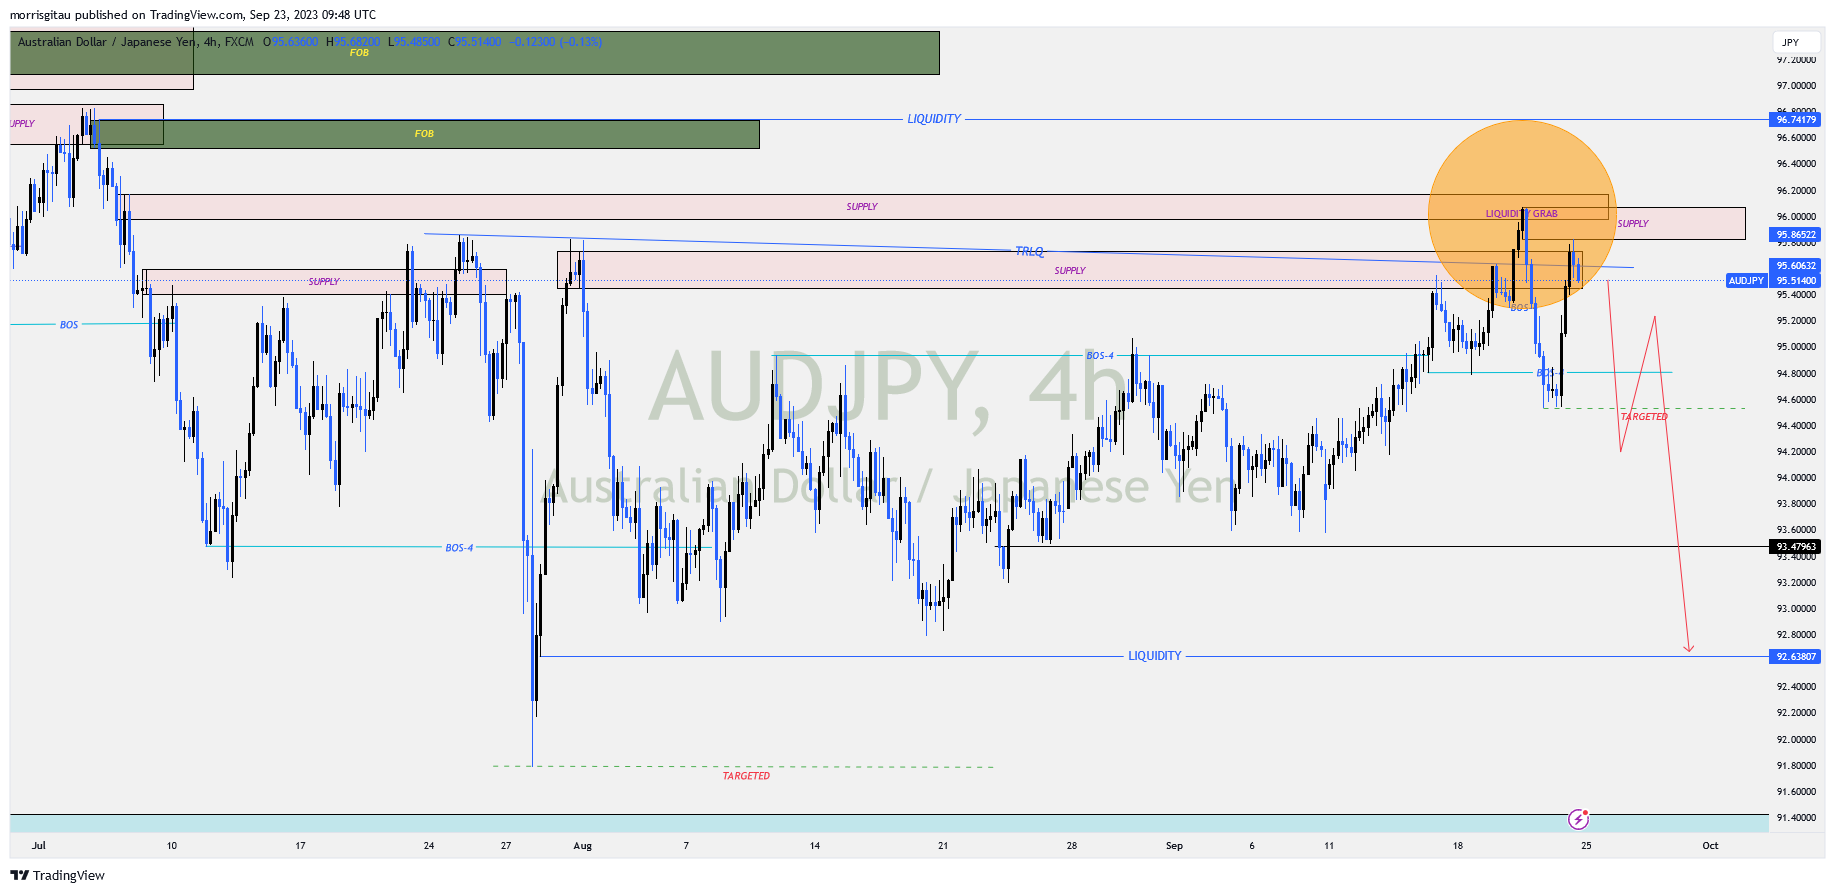
AUDJPY
AUDJPY CHART
There are signs the Bank of Japan (BOJ) want s to prop up the Japanese Yen (JPY). Presently, the yen is broadly weaker against major pairs. Late in week 38 of 2023, we saw signs of Yen recovery against the Australian Dollar (AUD). There was a break of structure indicating a shift in order flow. The ideal way to trade this pair is to wait for a second break, then place the sell limit orders accordingly. The targeted exit is the liquidity sitting below.
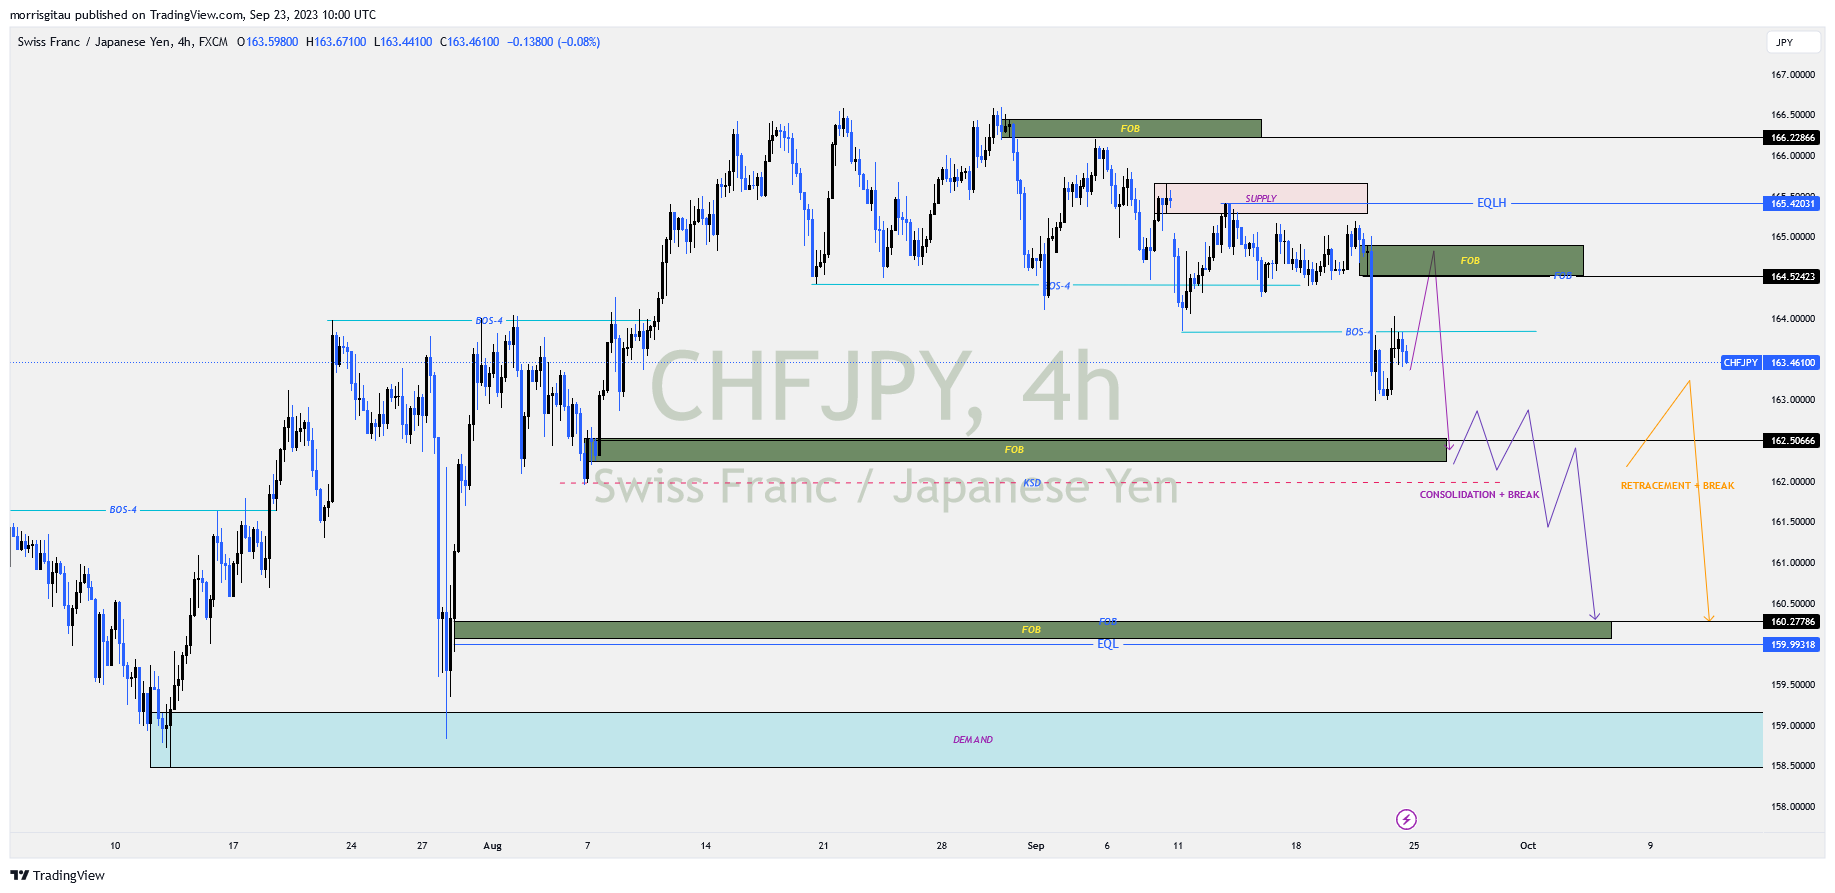
CHJPY
CHFJPY CHART
We maintain an overall bearish on cross JPY pairs. Though we missed an entry earlier in the week, there are premium sell opportunities we can exploit in the coming days. Once we have a second break, we will look for sell limit orders once the bullish correction move is complete. In the even the bearish move breaks lower then we either wait for a consolidation and a break or retracement and a break represented by the purple and orange arrows respectively.
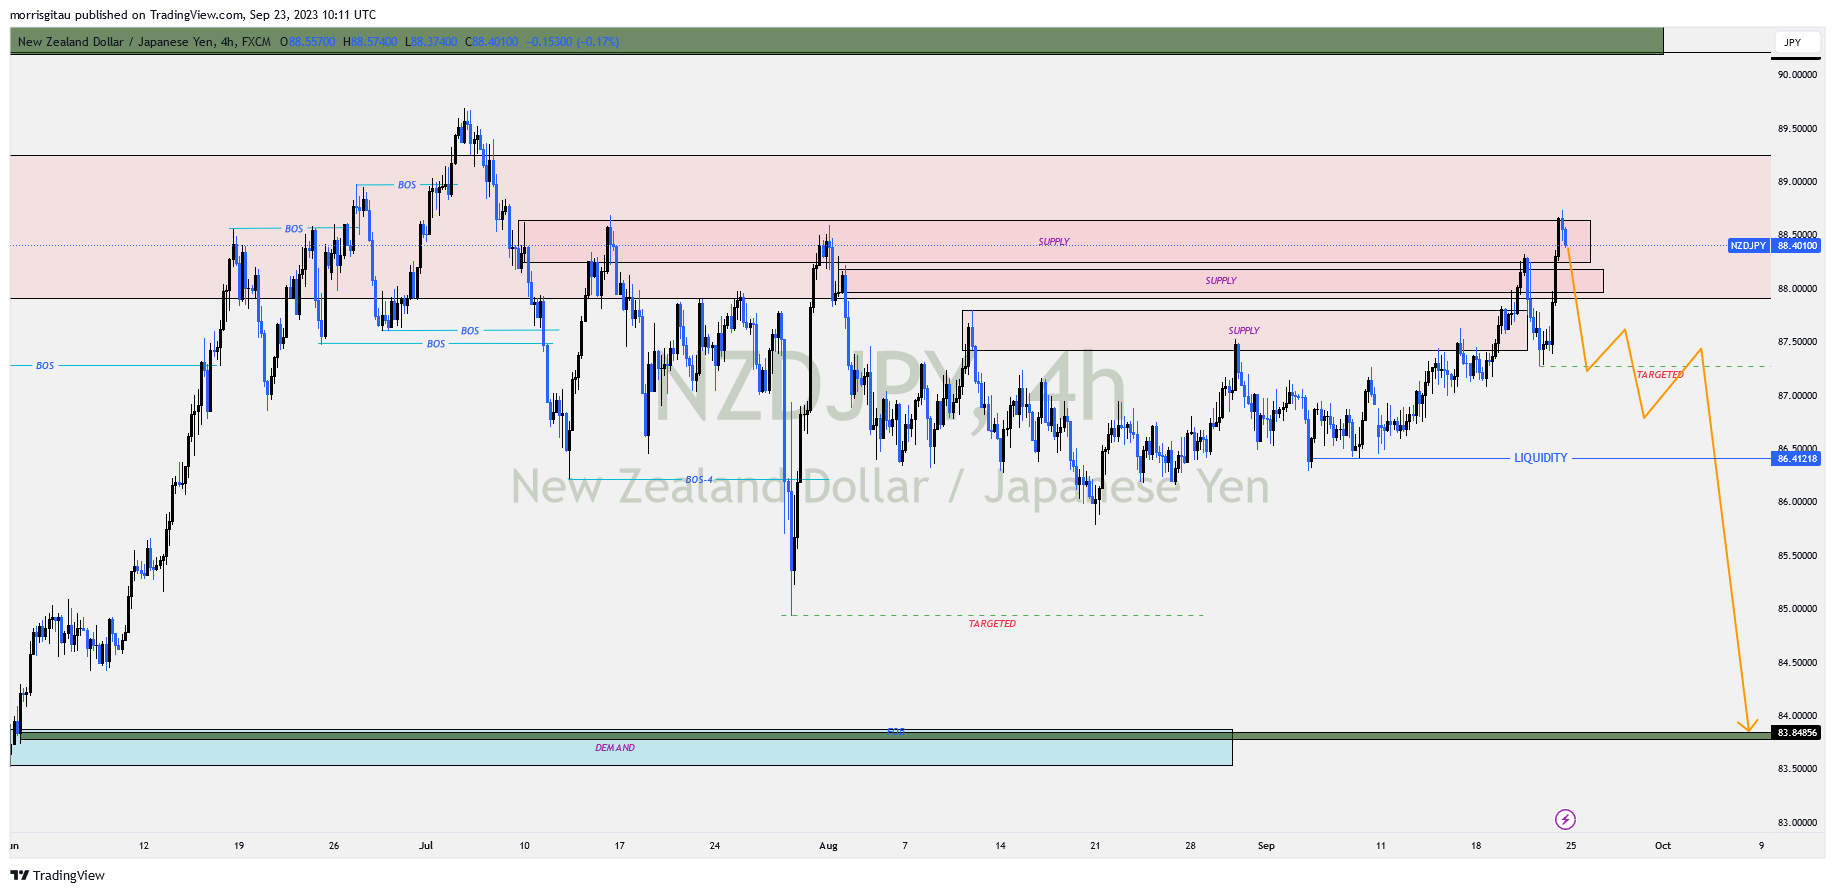
NZDJPY
On the 4 hour chart, we are anticipating a change of character (CHOCH) confirming a shift in order flow. Once we register the CHOCH, we will look for sell limits targeting the 83.85 price handle. Kindly note, this is not a confirmed sell set up.
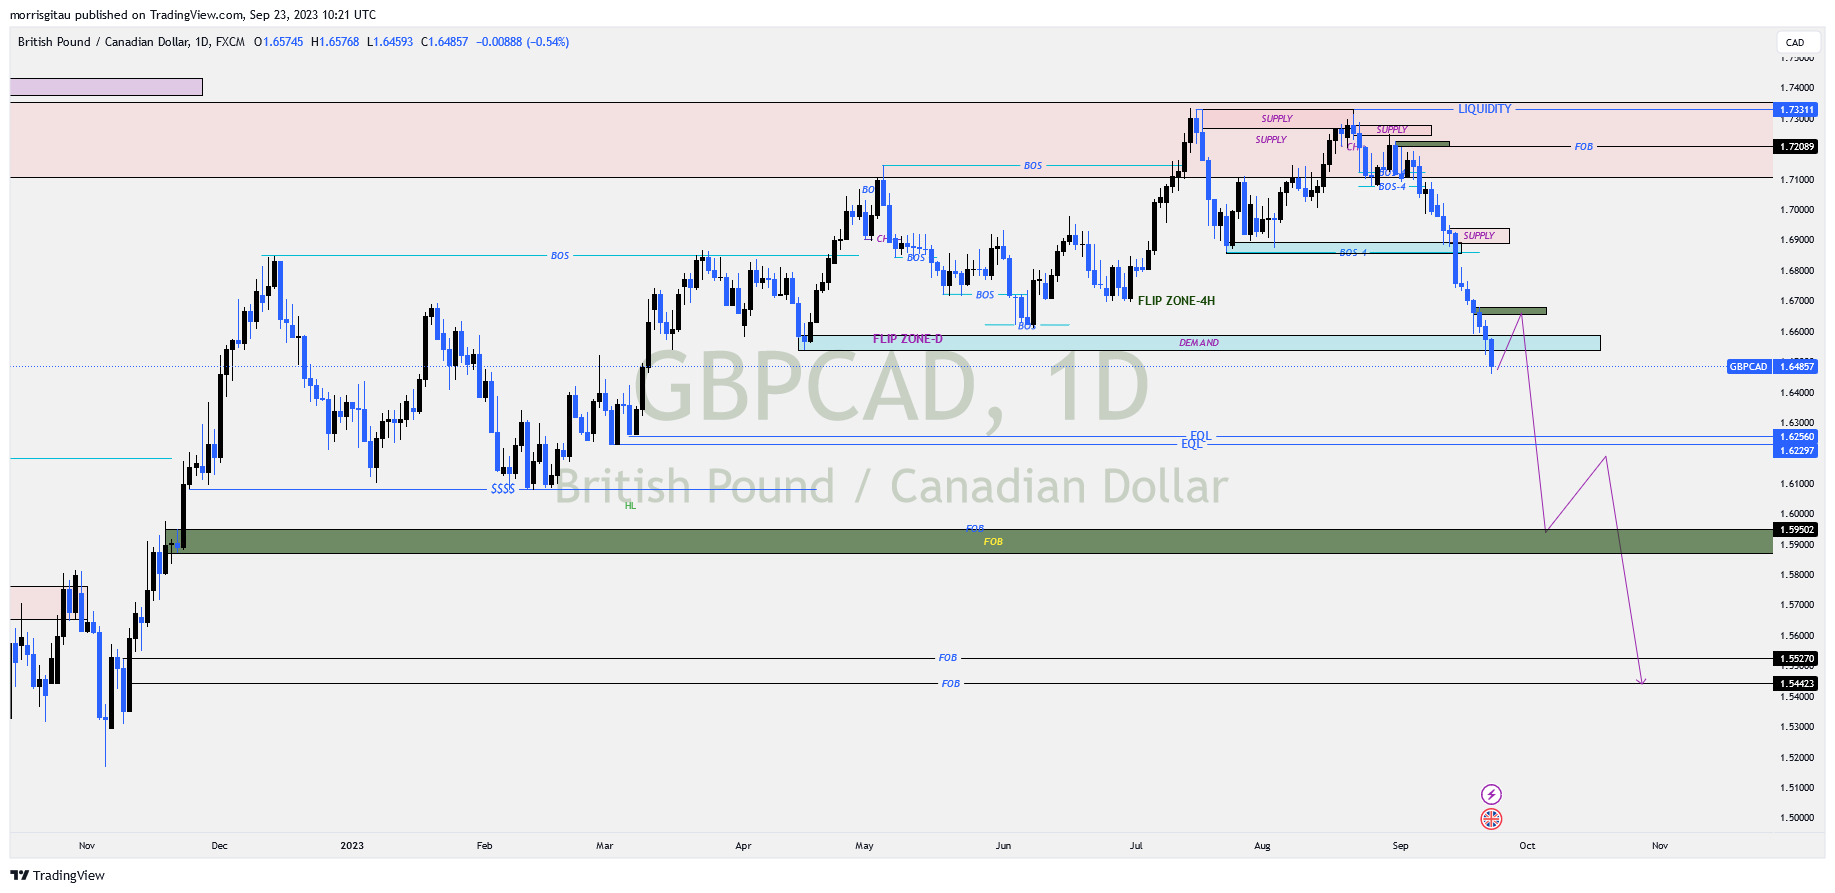
GBPCAD
GBPCAD CHART
Early September, the sell set for GBPCAD was posted on my Instagram page. The oil price rally is positively correlated with the rally in Canadian Dollar (CAD). We see UKOIL and USOIL rallying to 100-115 price handles, this of course will push the value of CAD. That informs our sell outlook for cross CAD pairs. On the 4 hour chart we have market a possible sell limit entry targeting the liquidity at 1.62 to 1.61. Patient swing traders can hold the trade targeting the fresh order block at 1.553. Join my telegram channel for access to updated set ups.
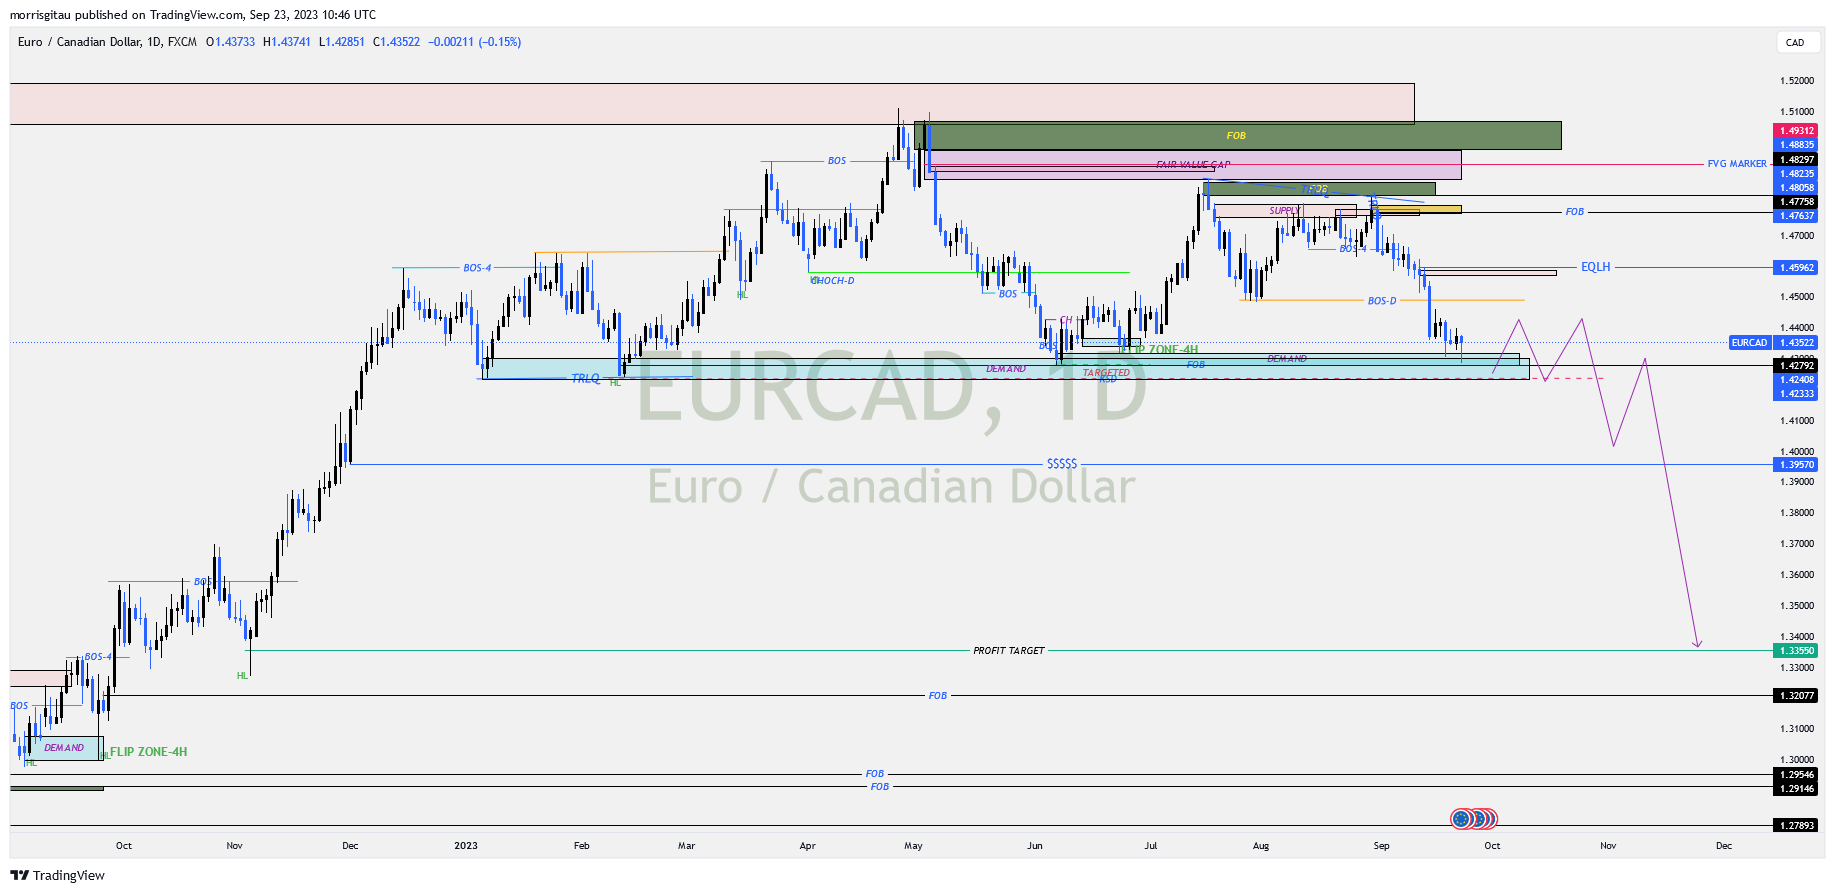
EURCAD
EURCAD CHART
Presently, we are settled in a previous flip zone. We are awaiting a break to the downside for us to confirm the sell set up. If the key structure daily is broken, we will look for sell limit during the bullish correction targeting the 1.32 zones.
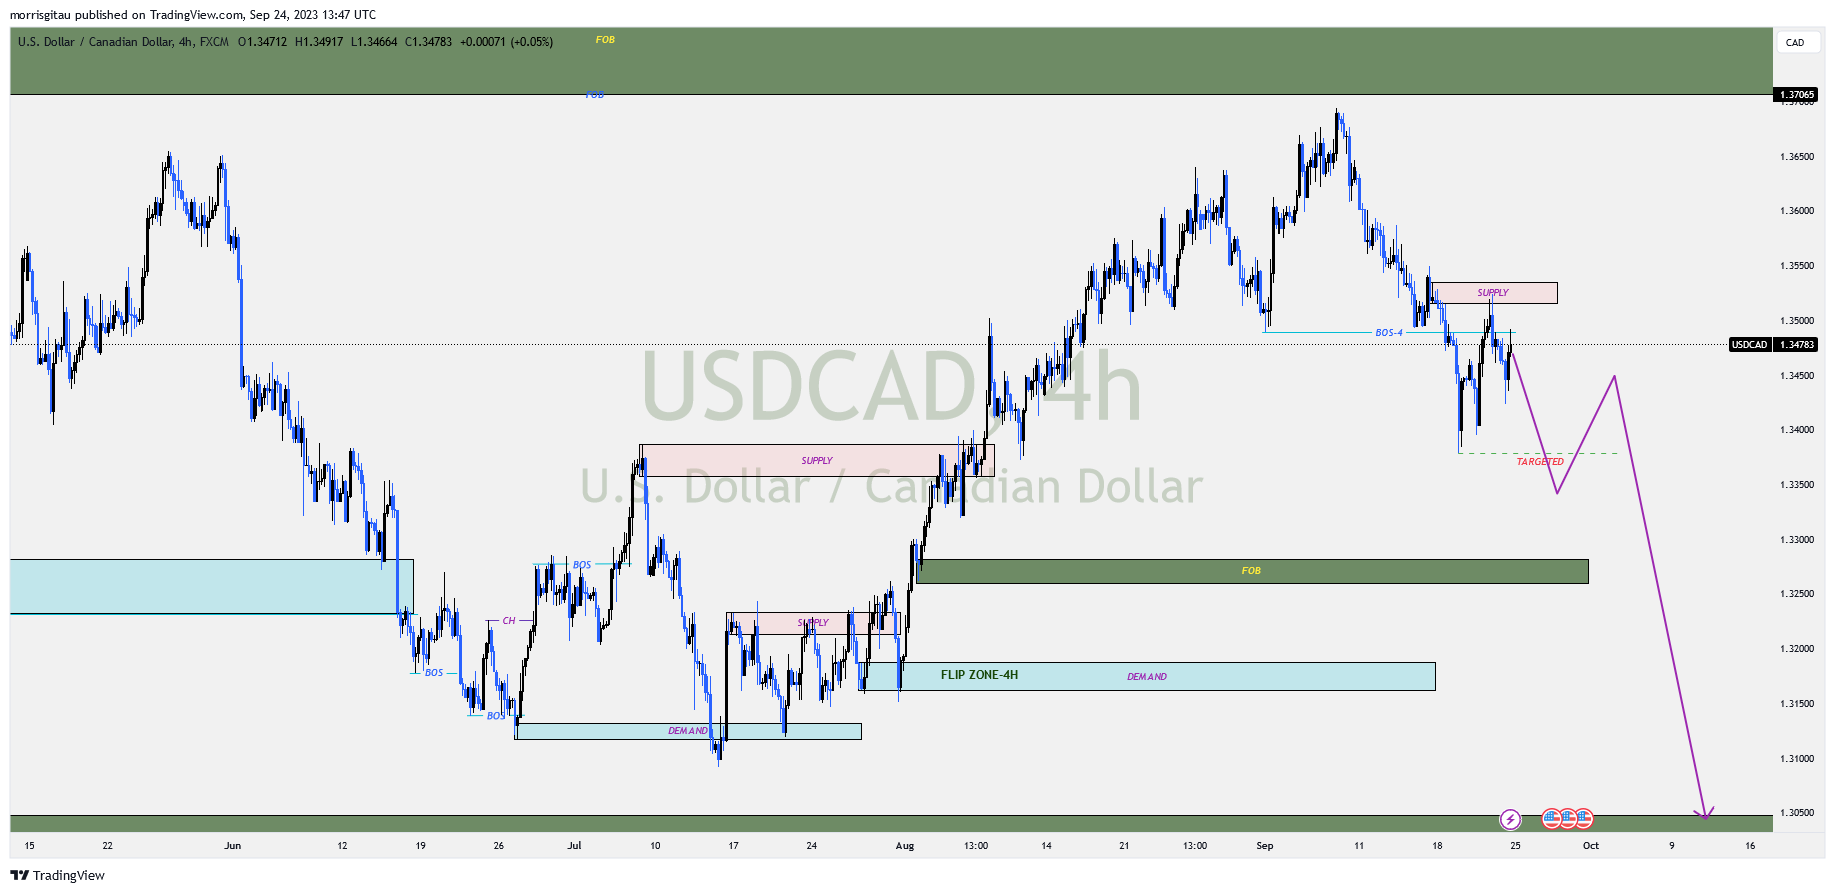
USDCAD
USDCAD CHART
As outlined before, we have a bearish outlook on cross CAD pairs. Previously, we had a break of structure and a quick correction that we missed an entry. We shall be awaiting for a break to the downside, thereafter we shall seek to place out sell limit orders during the correction. Our projected exit is the fresh order block at 1.305 price handle.
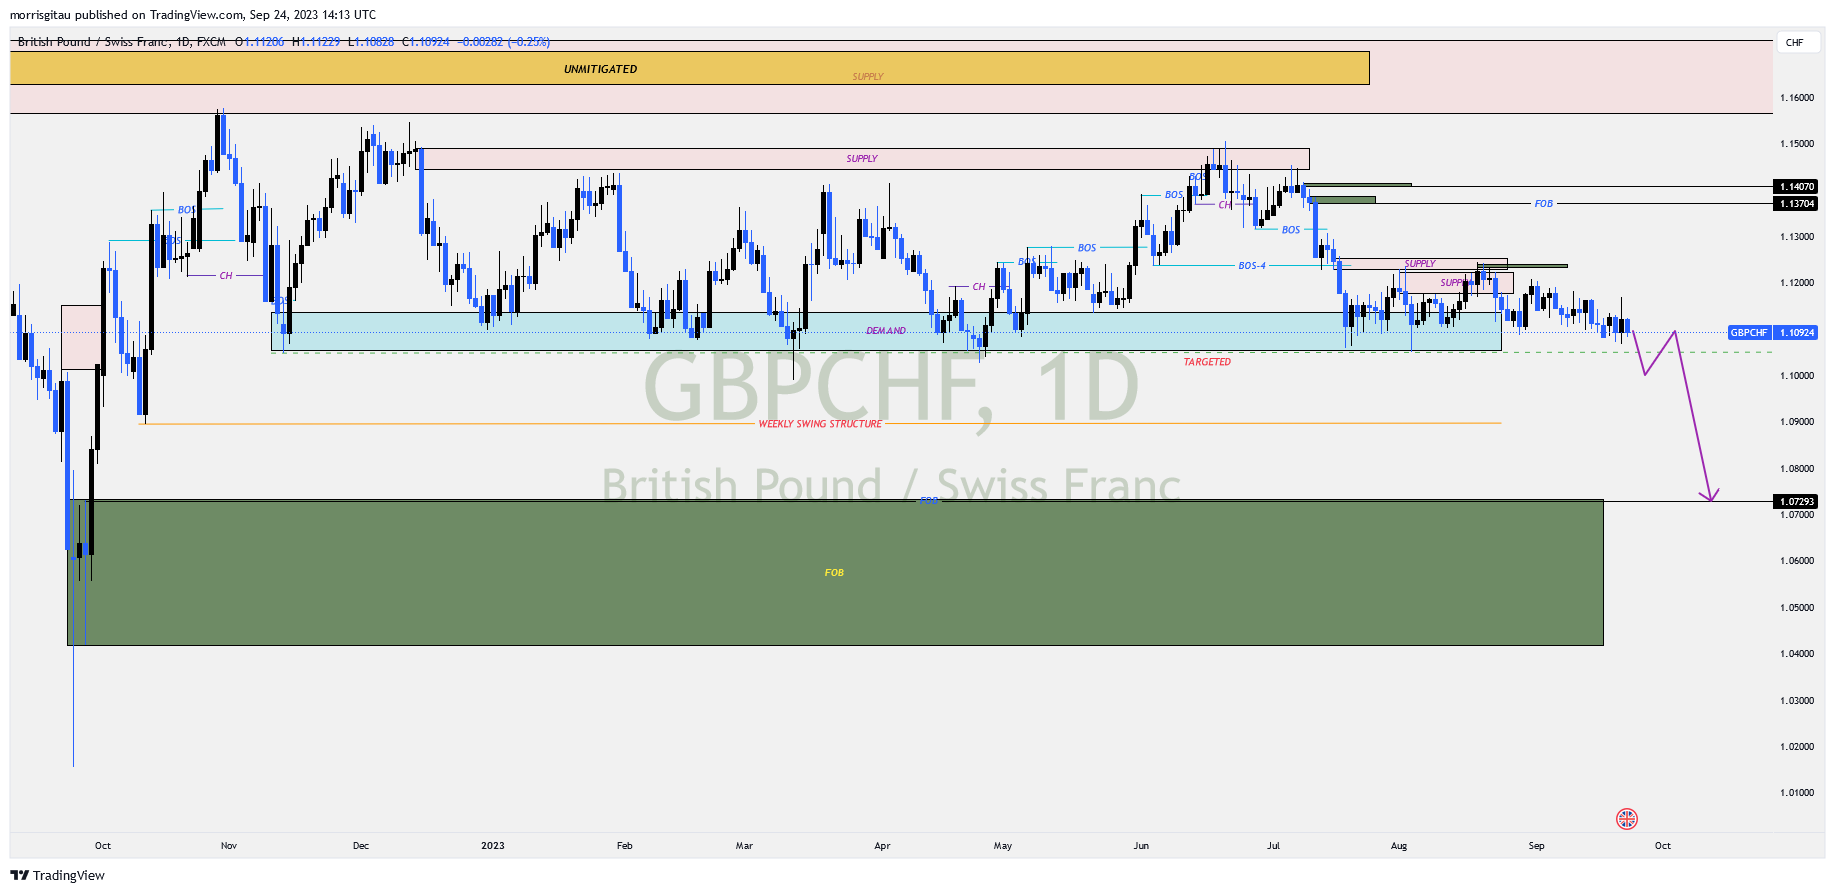
GBPCHF
GBPCHF CHART
We are witnessing the British Pound (GBP) broadly weakening against other major currencies. For the better part of Q3, GBPCHF has settled and consolidated around the demand area. For us to exploit this opportunity, we shall wait for a break of the key structure, thereafter we shall look for sell opportunities targeting the fresh order block at 1.073 as our exit area.
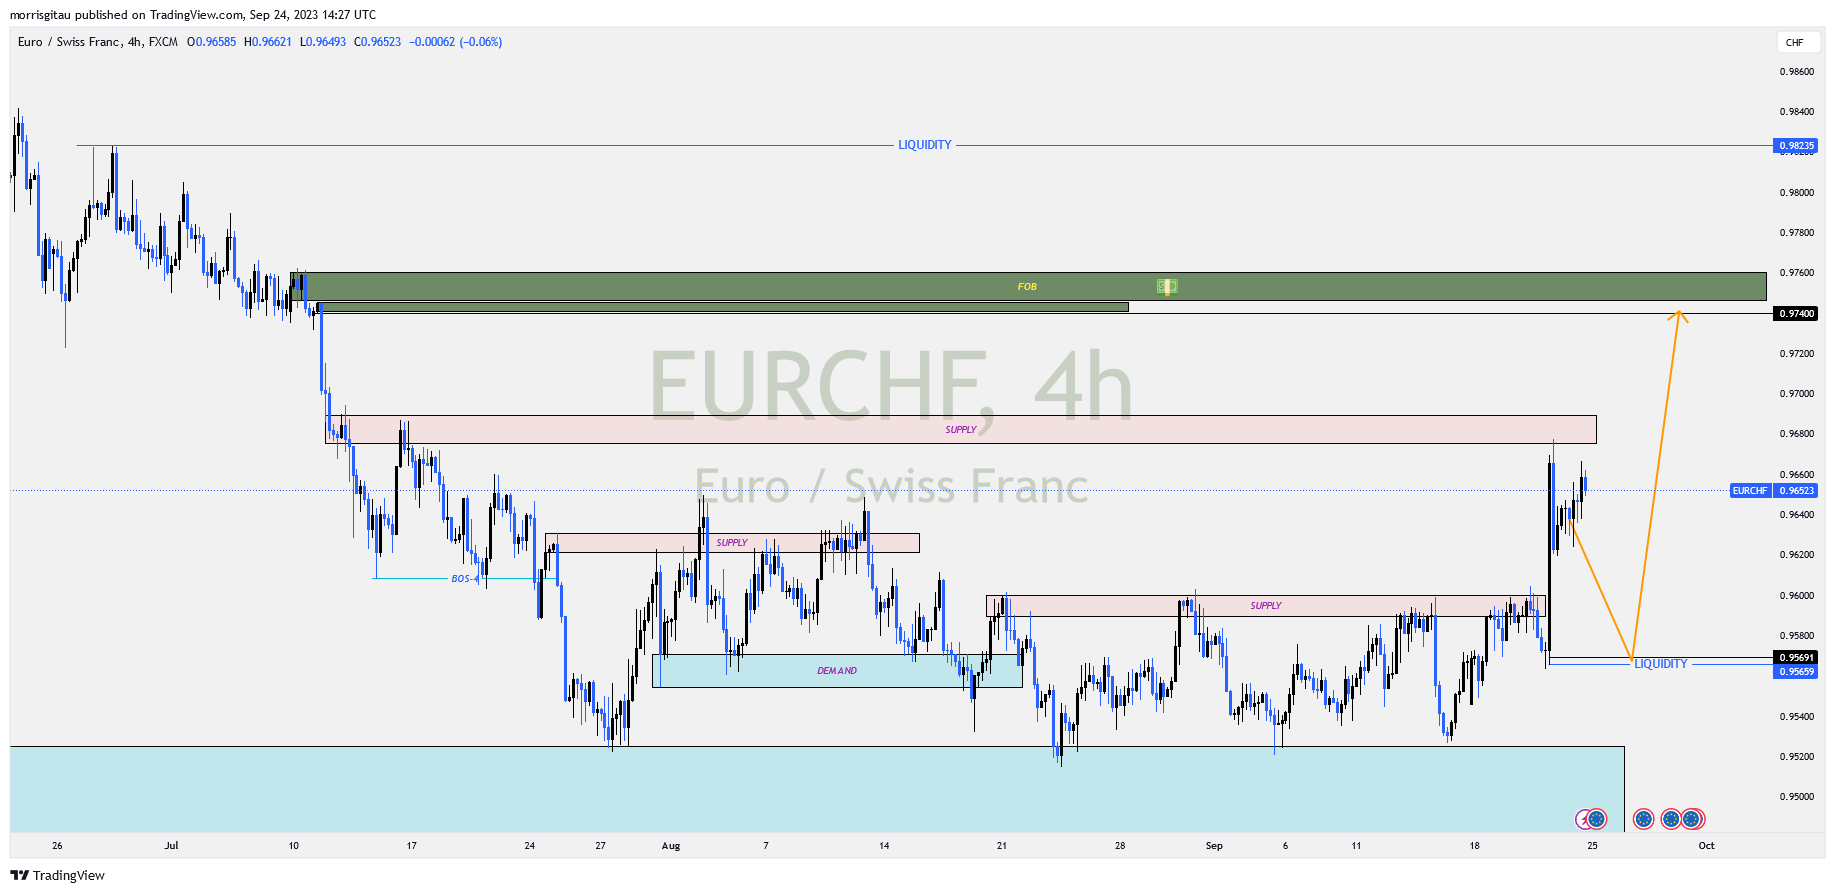
EURCHF
EURCHF CHART
Towards the close of Q3, the Swiss Franc (CHF) was broadly higher against other major currencies. The decision by the Swiss National Bank (SNB) to retain the rates at the present levels caught the market by surprise. We saw a EURCHF rally that is likely to correct the coming days, key word, likely. We have our buy limit orders placed at the flip zone liquidity 0.95660 targeting the upside fresh order block at 0.974.
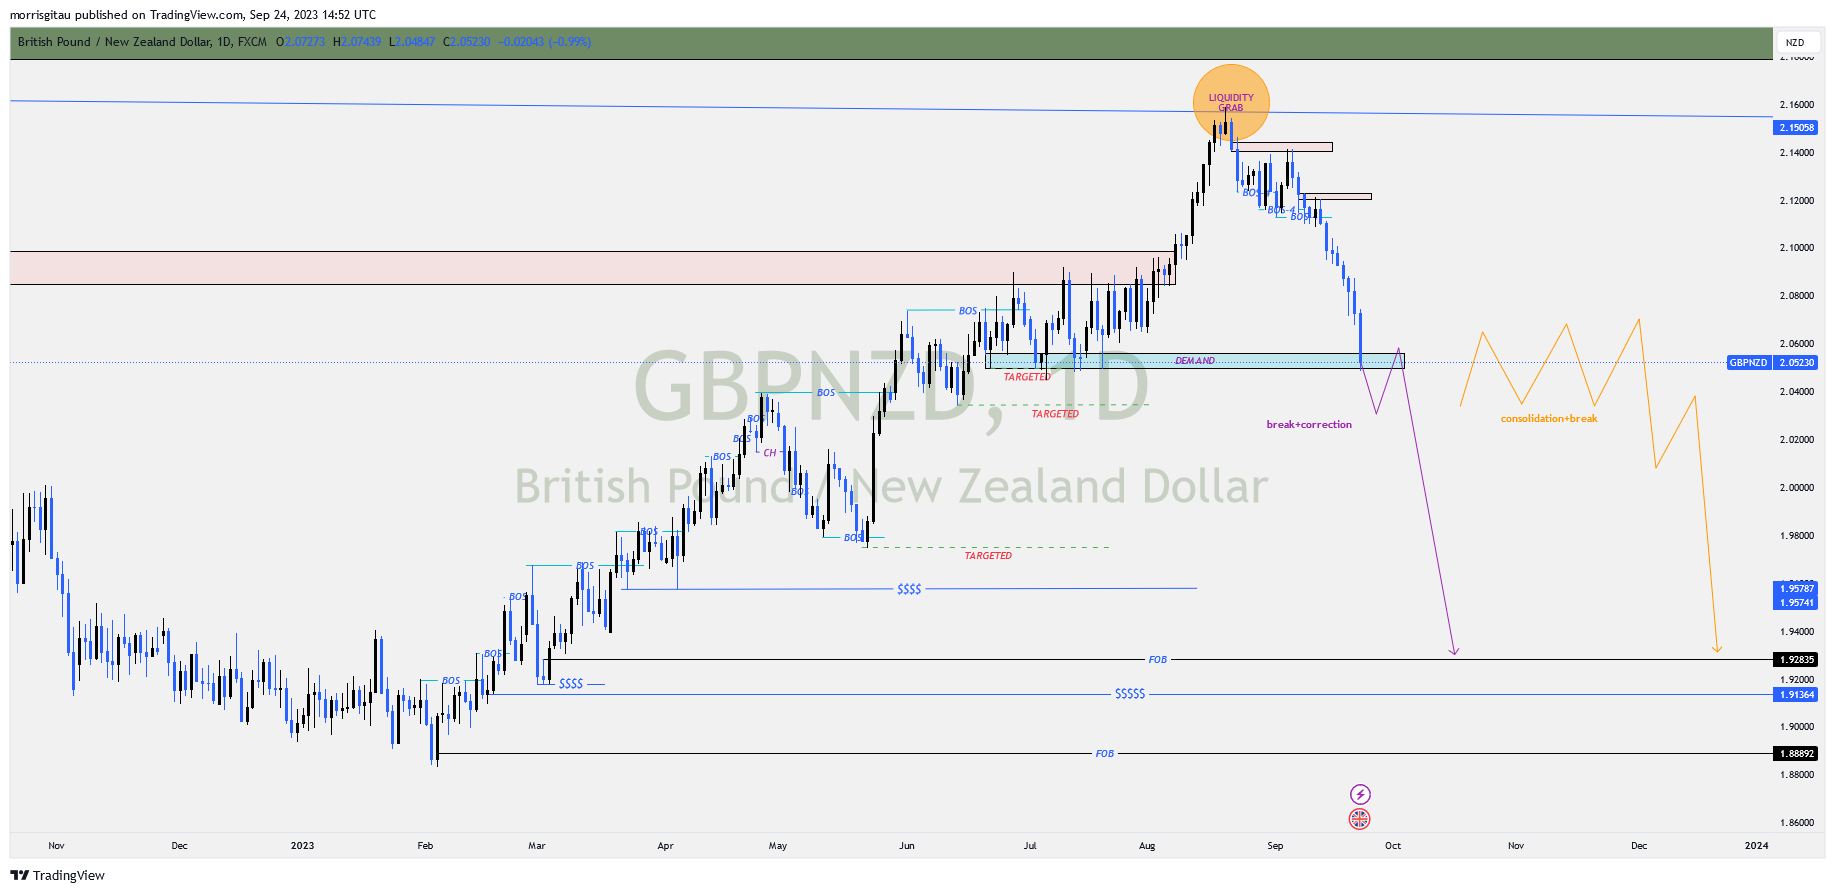
GBPNZD
GBPNZD CHART
The British pound is weakening broadly against major currencies. Presently, against the New Zealand Dollar (NZD), the pair has settled in a strong demand/flip zone area. We have two possibilities likely to play out next week, a consolidation and a break (orange arrow) or a break and a correction (purple arrow). Either way, we are looking for sell limits once there is a break to the downside.
EURNZD
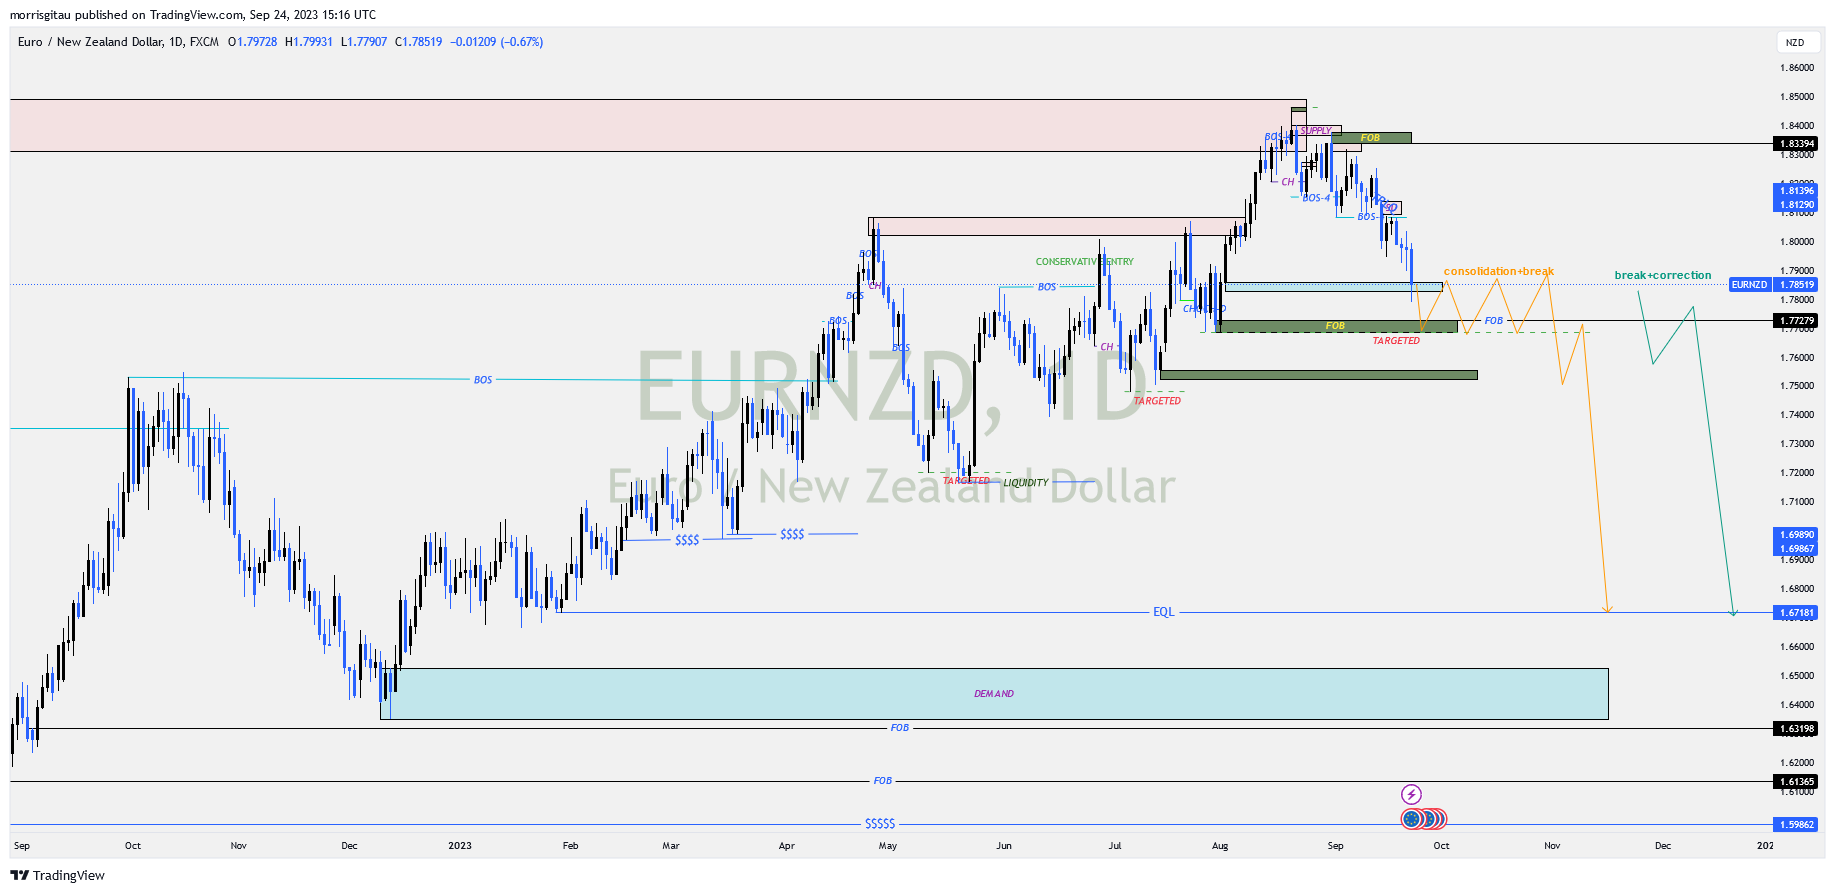
EURNZD CHART
New Zealand Dollar (NZD) is gradually gaining ground towards the close of Q3,2023. For the better part of Q1 and Q2, NZD was weaker across the board. Weak Chinese data hurt the AUD and NZD. Presently, we are witnessing a possible shift in order flow from bullish to bearish. Once there is a break of structure from the current market price, we are anticipating a consolidation or a clean break. Either way, we are looking for sell limit orders targeting the liquidity at 1.672.
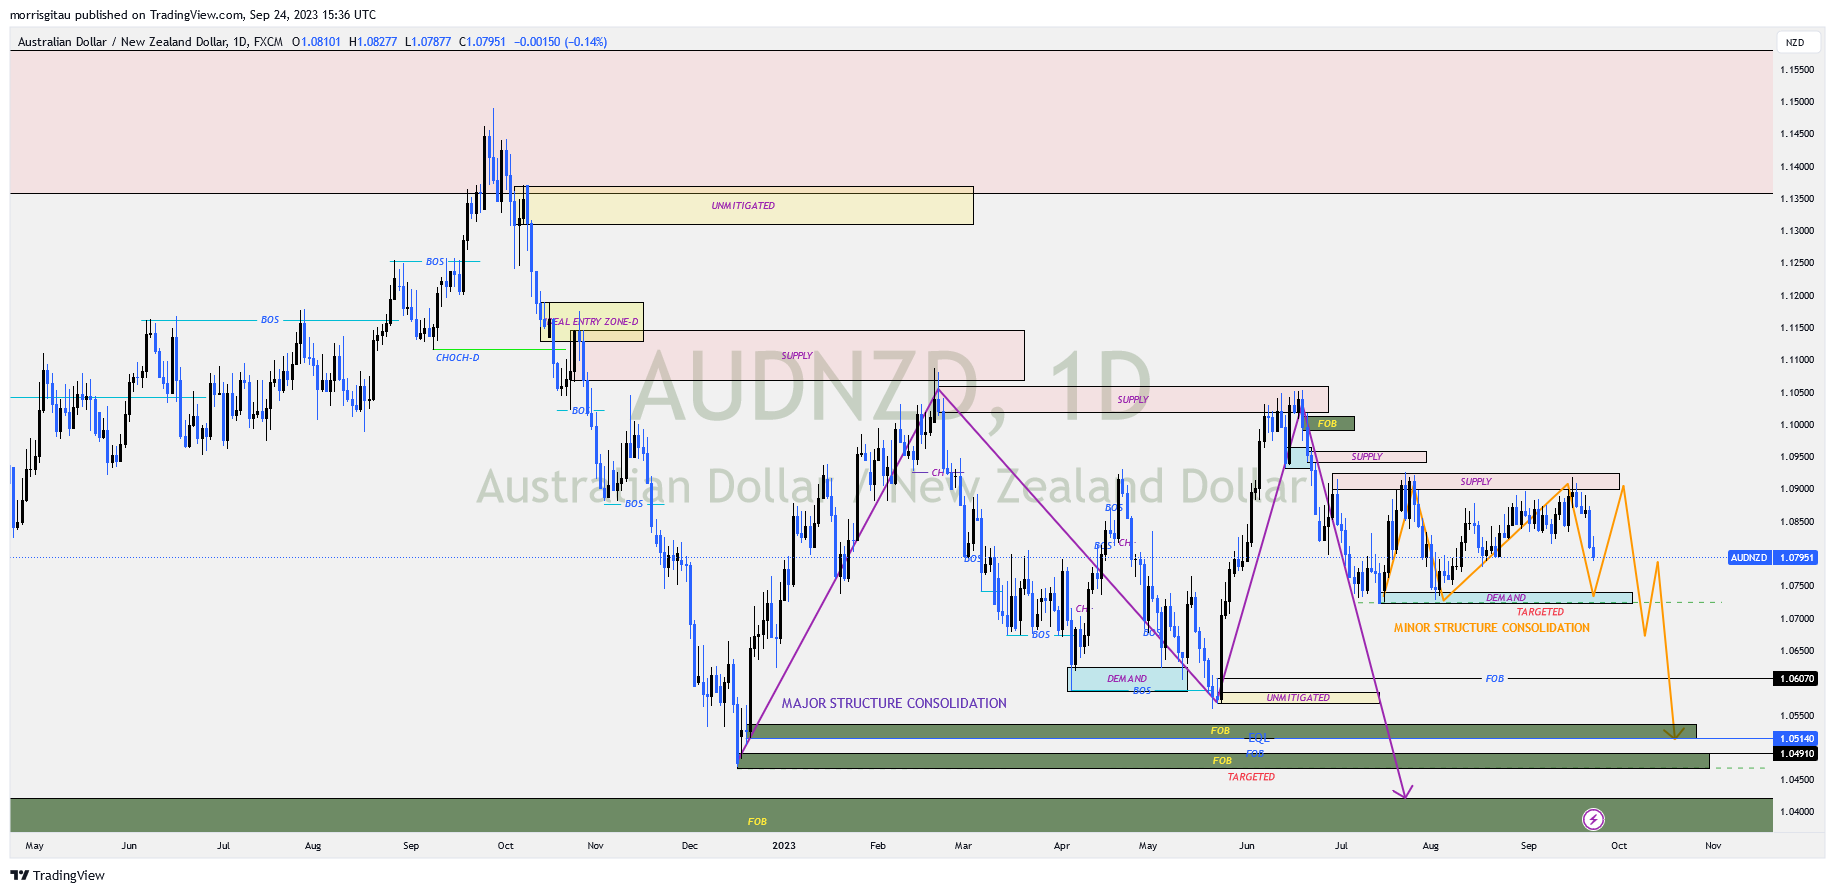
AUDNZD
AUDNZD CHART
We have a combination of major and minor consolidation represented by the purple and orange arrows respectively. The major trend is bearish though we are witnessing consolidations on the 4 hour and daily charts. Once we register a break of structure on the minor structure, we will look for sell limit orders targeting the liquidity at 1.0514 price handle.