Author: Gitau Morris

  • PSYCHOLOGY IN FOREX TRADING

    PSYCHOLOGY IN FOREX TRADING

    PSYCHOLOGY IN FOREX TRADING

    FOREX TRADING PSYCHOLOGY

    Recently, a friend requested I give a talk on forex trading psychology, needless to say it wasn’t necessarily a request. The matter was already decided, I had to assume the responsibility of preparing for the talk.

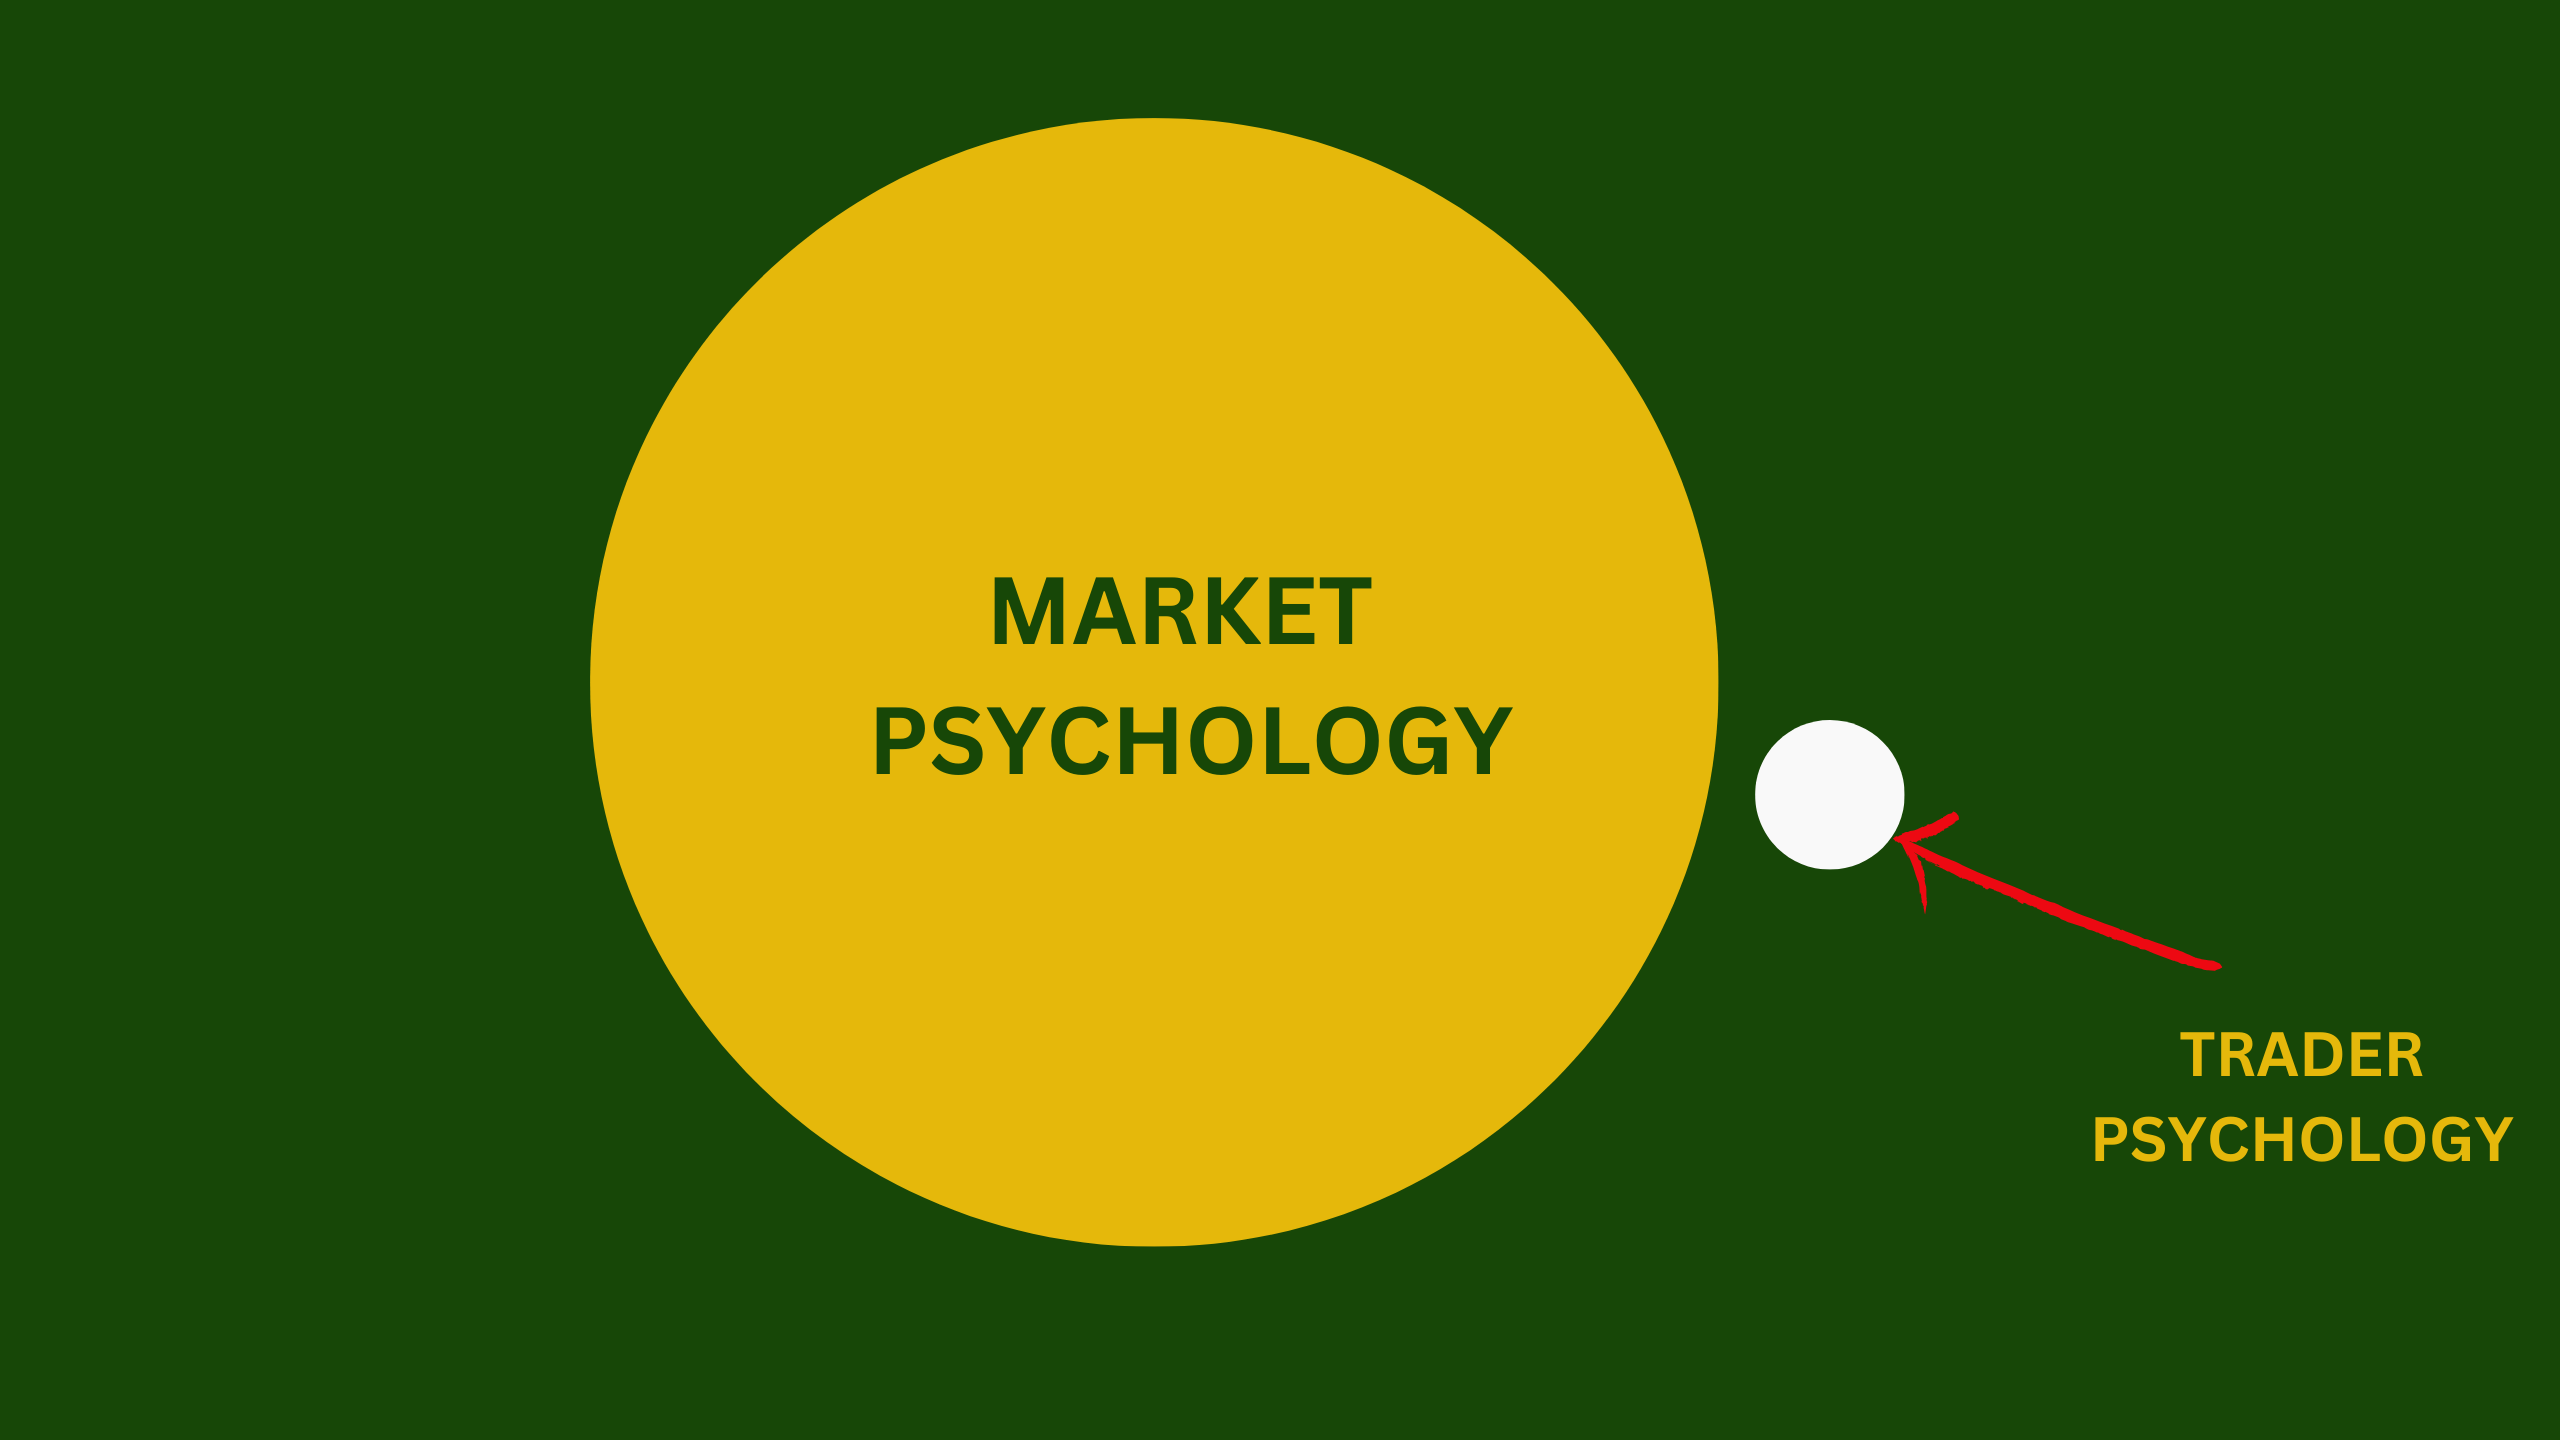
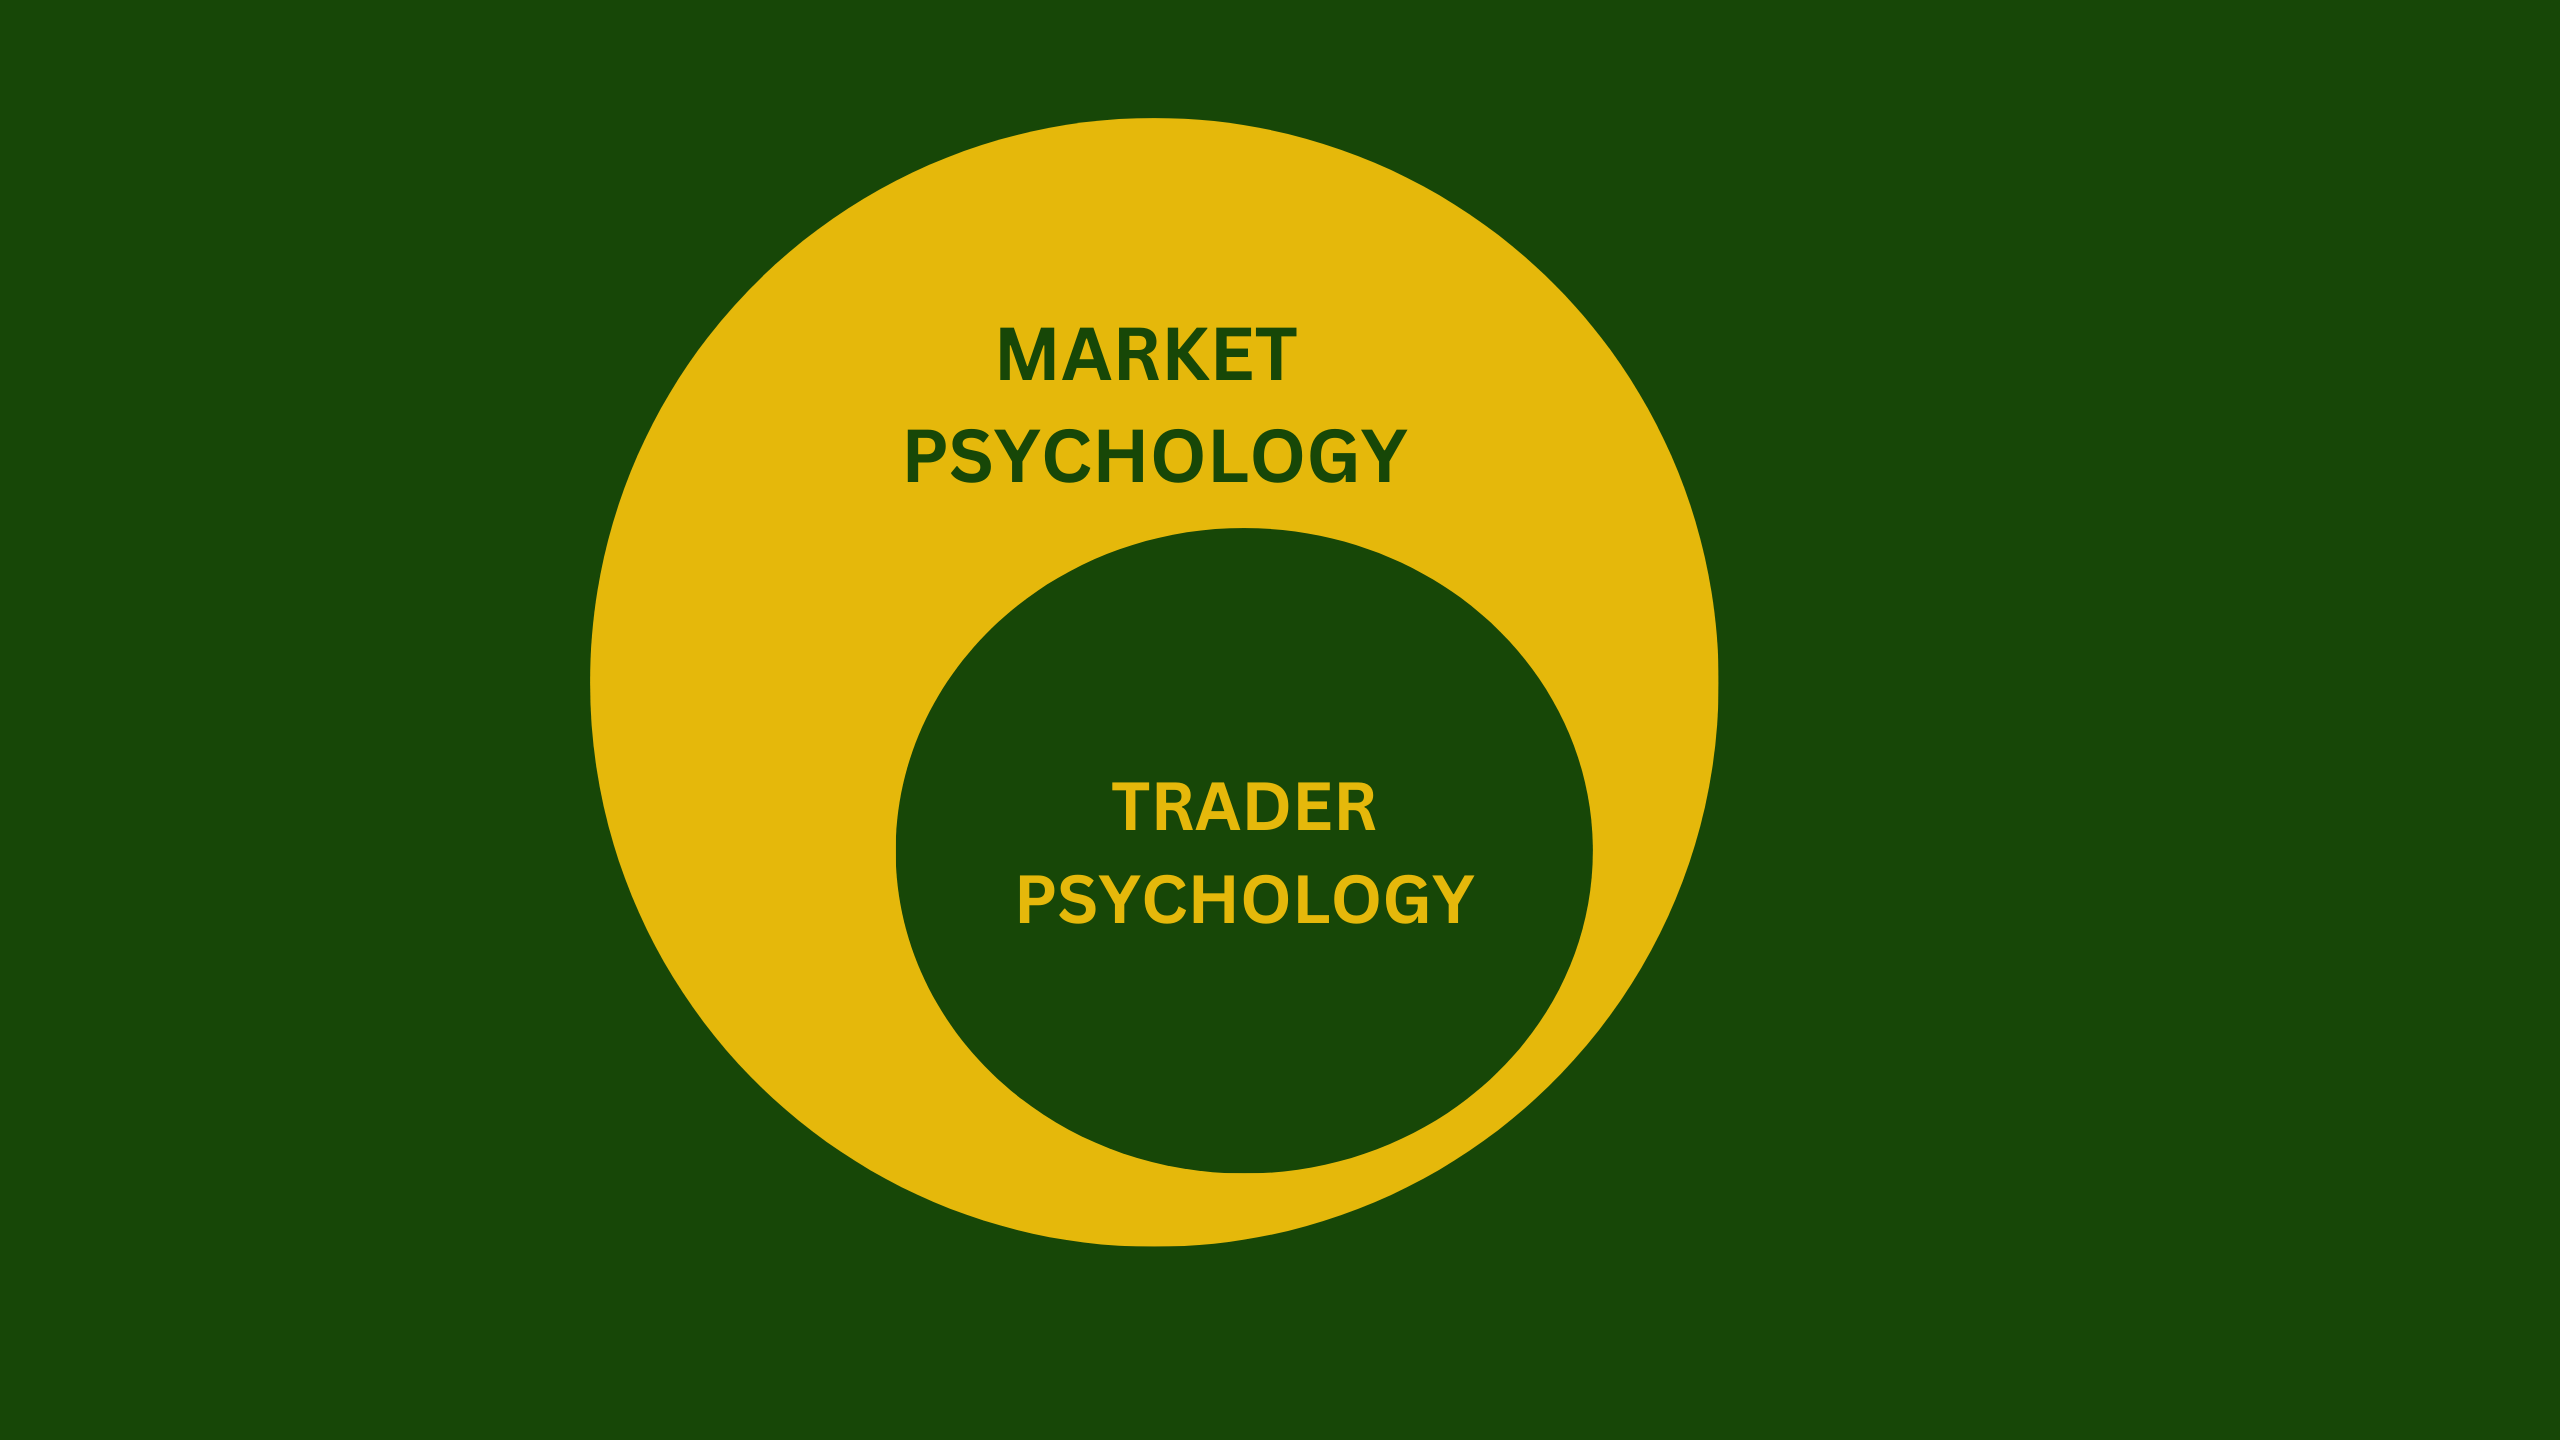
    I have spent the better part of January 2024 trying to figure out and generate content on this subject matter. I have come to a conclusion; market psychology is the mother of trading psychology. We tend to view individual trading psychology independent of the market, our trading results can confirm this.

    SEPARATE PSYCHOLOGY
    SEPARATE PSYCHOLOGY

    Allow me to develop the conceptual framework that leads to my conclusion. For the better part of this article, I will advocate for market psychology as opposed to trading psychology, a matter of perspective.

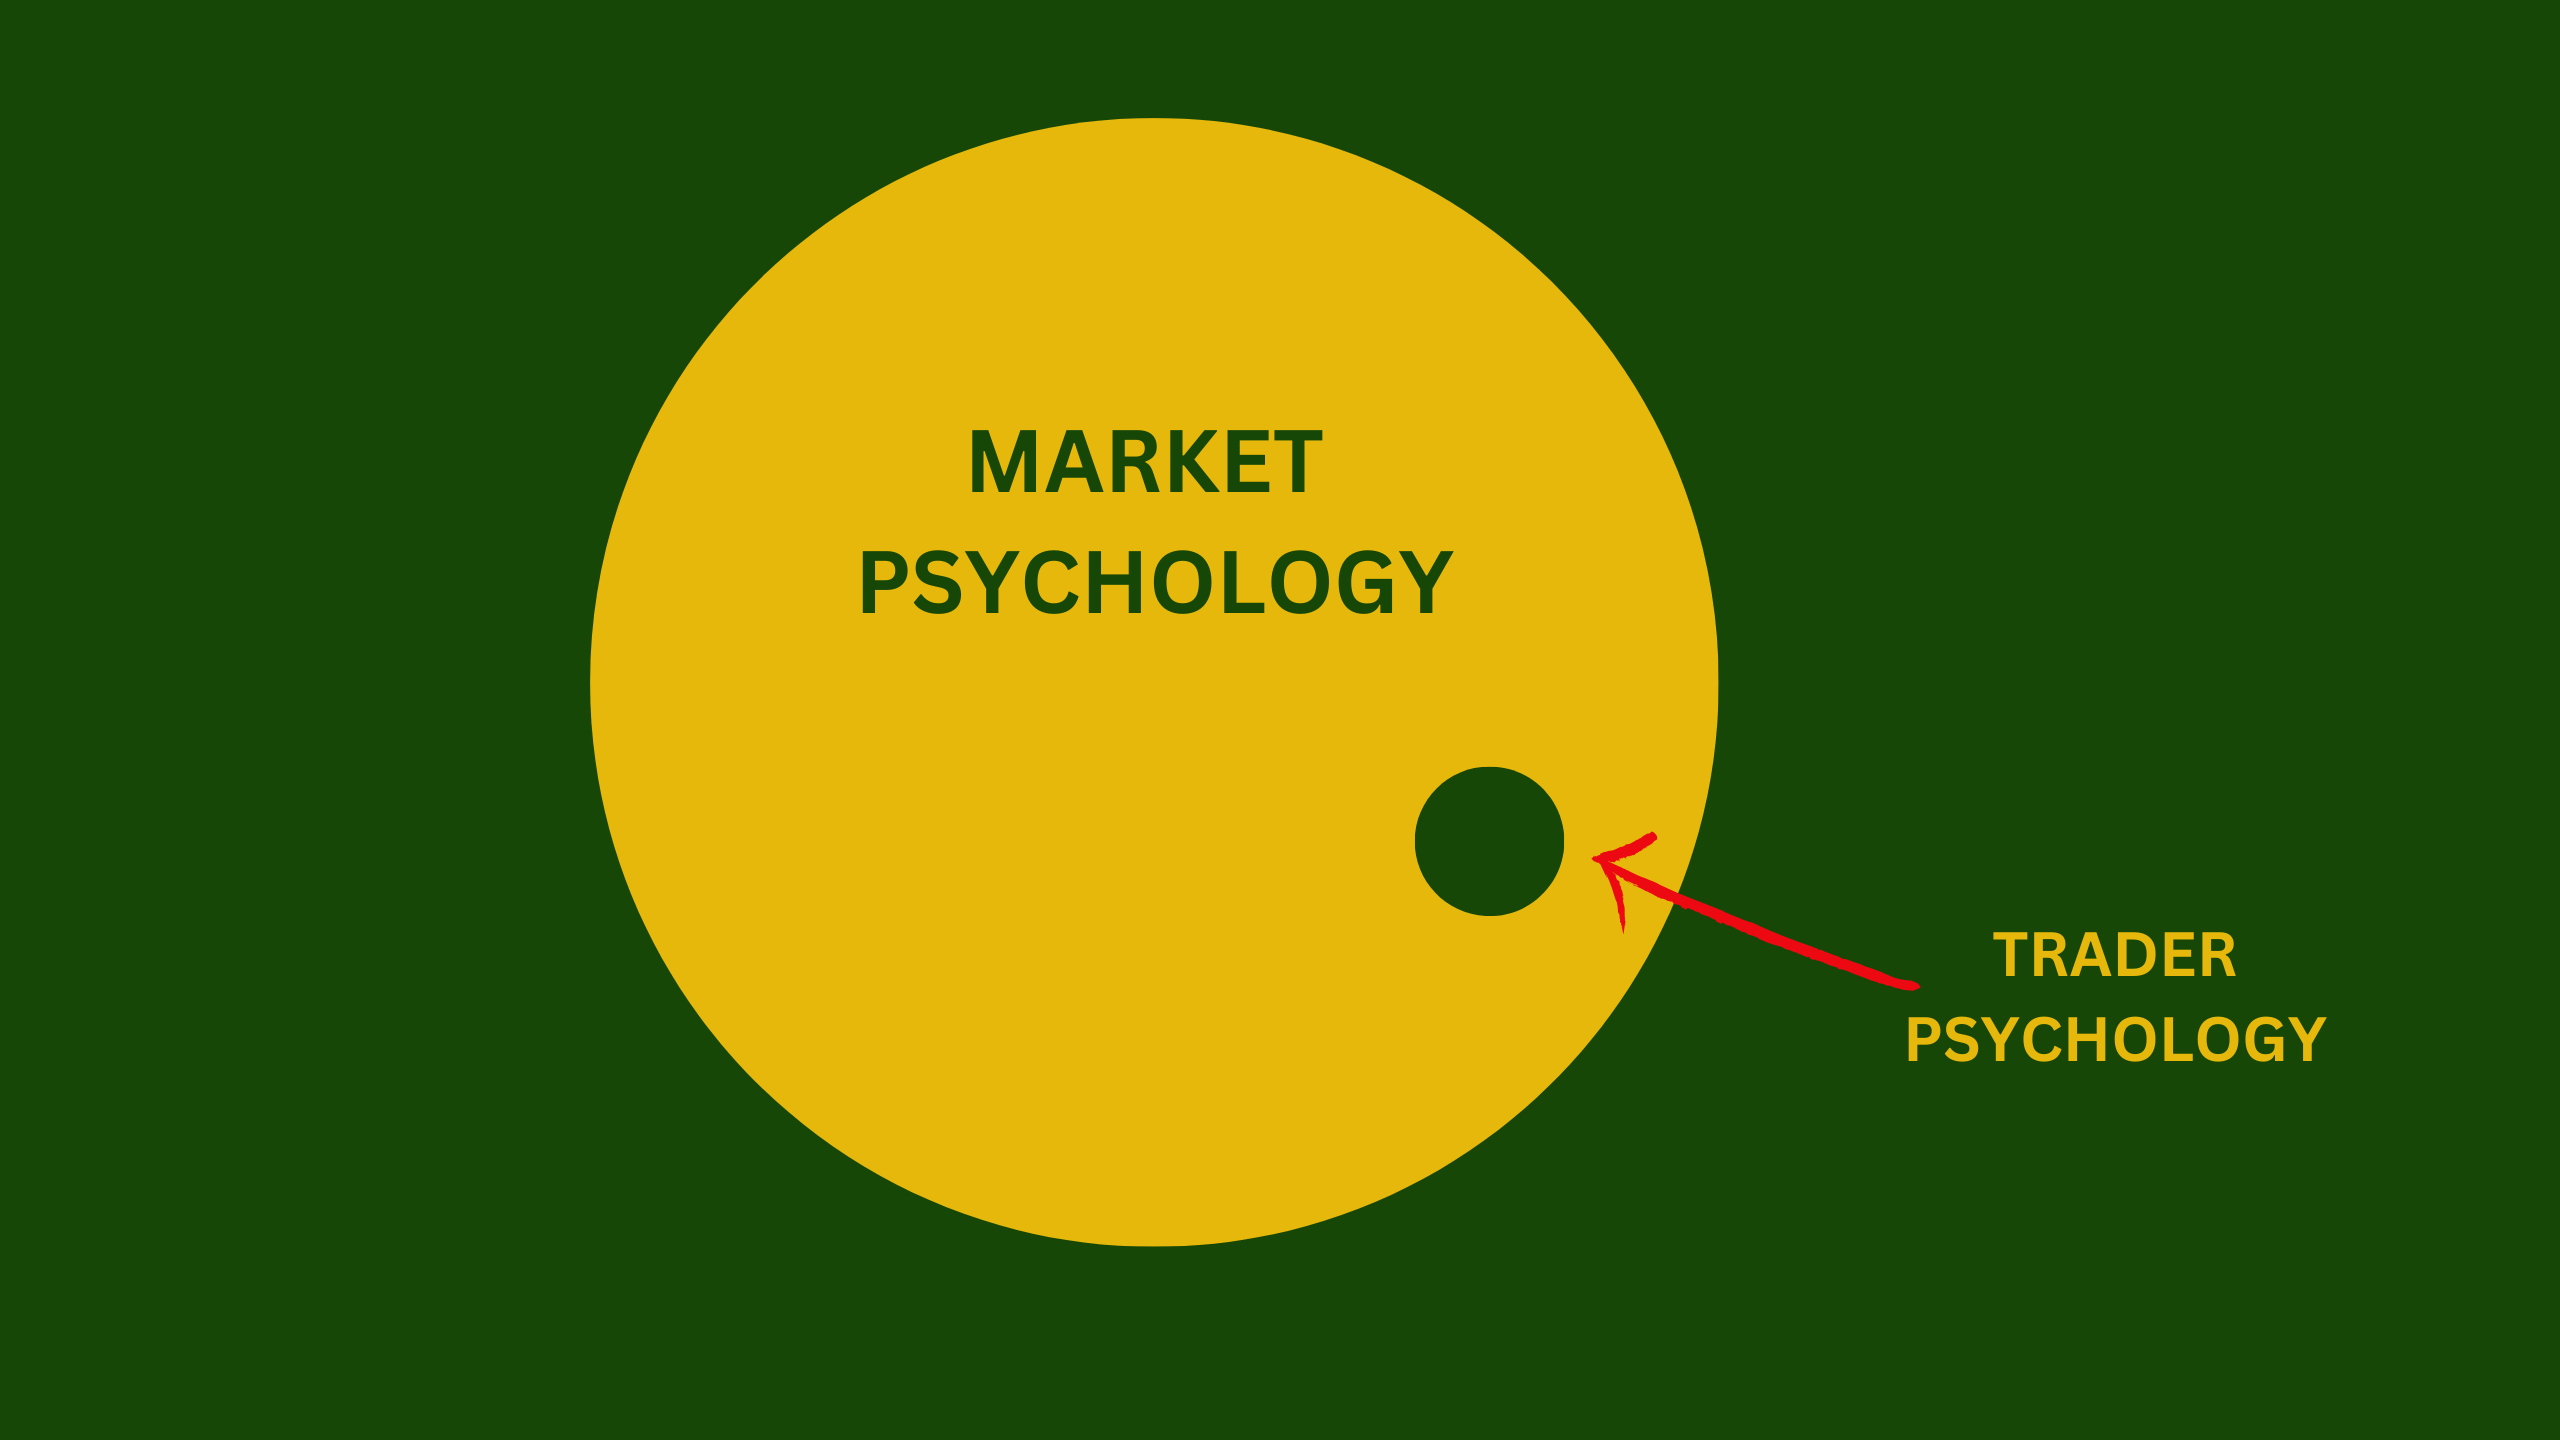
    Psychology by definition is the study of behavior, ideally with the intention of increased understanding. I will also share that environments do dictate behavior. Therefore, market psychology(environment) is superior to trading psychology. In other words, the behavior of the market determines the behavior of traders.

    With this framework, would it be ideal to study market psychology? Ultimately, we will understand ourselves better. In my experience, I have learnt that the market is both mean and generous in equal measure. It depends what side you receive. Is it possible to consistently receive her generosity? Yes, it is. How do we do this?

    Firstly, we need to understand and accept that;

    1. The market doesn’t care about you or your goals.
    2. The market doesn’t care about your desire and timelines.
    3. The market doesn’t care that you use indicators or whatever trading style
    4. The market doesn’t care that you use technical or fundamental analysis
    5. The market doesn’t care about your emotions, it is not in a relationship with you.

      The market doesn’t care.

      The market only cares about one thing; efficient price delivery.

      Reason would dictate that we need to approach the market without ANY expectations. Submit to the market, seek to learn its price delivery behavior (psychology) and then it shall reveal itself to you. Gradually, the market modifies your behavior and mindset. Therefore, consistent exposure and pursuit of market psychology builds and modifies individual trader psychology.

      ALIGNEMENT OF PSYCHOLOGY
      ALIGNEMENT OF PSYCHOLOGY

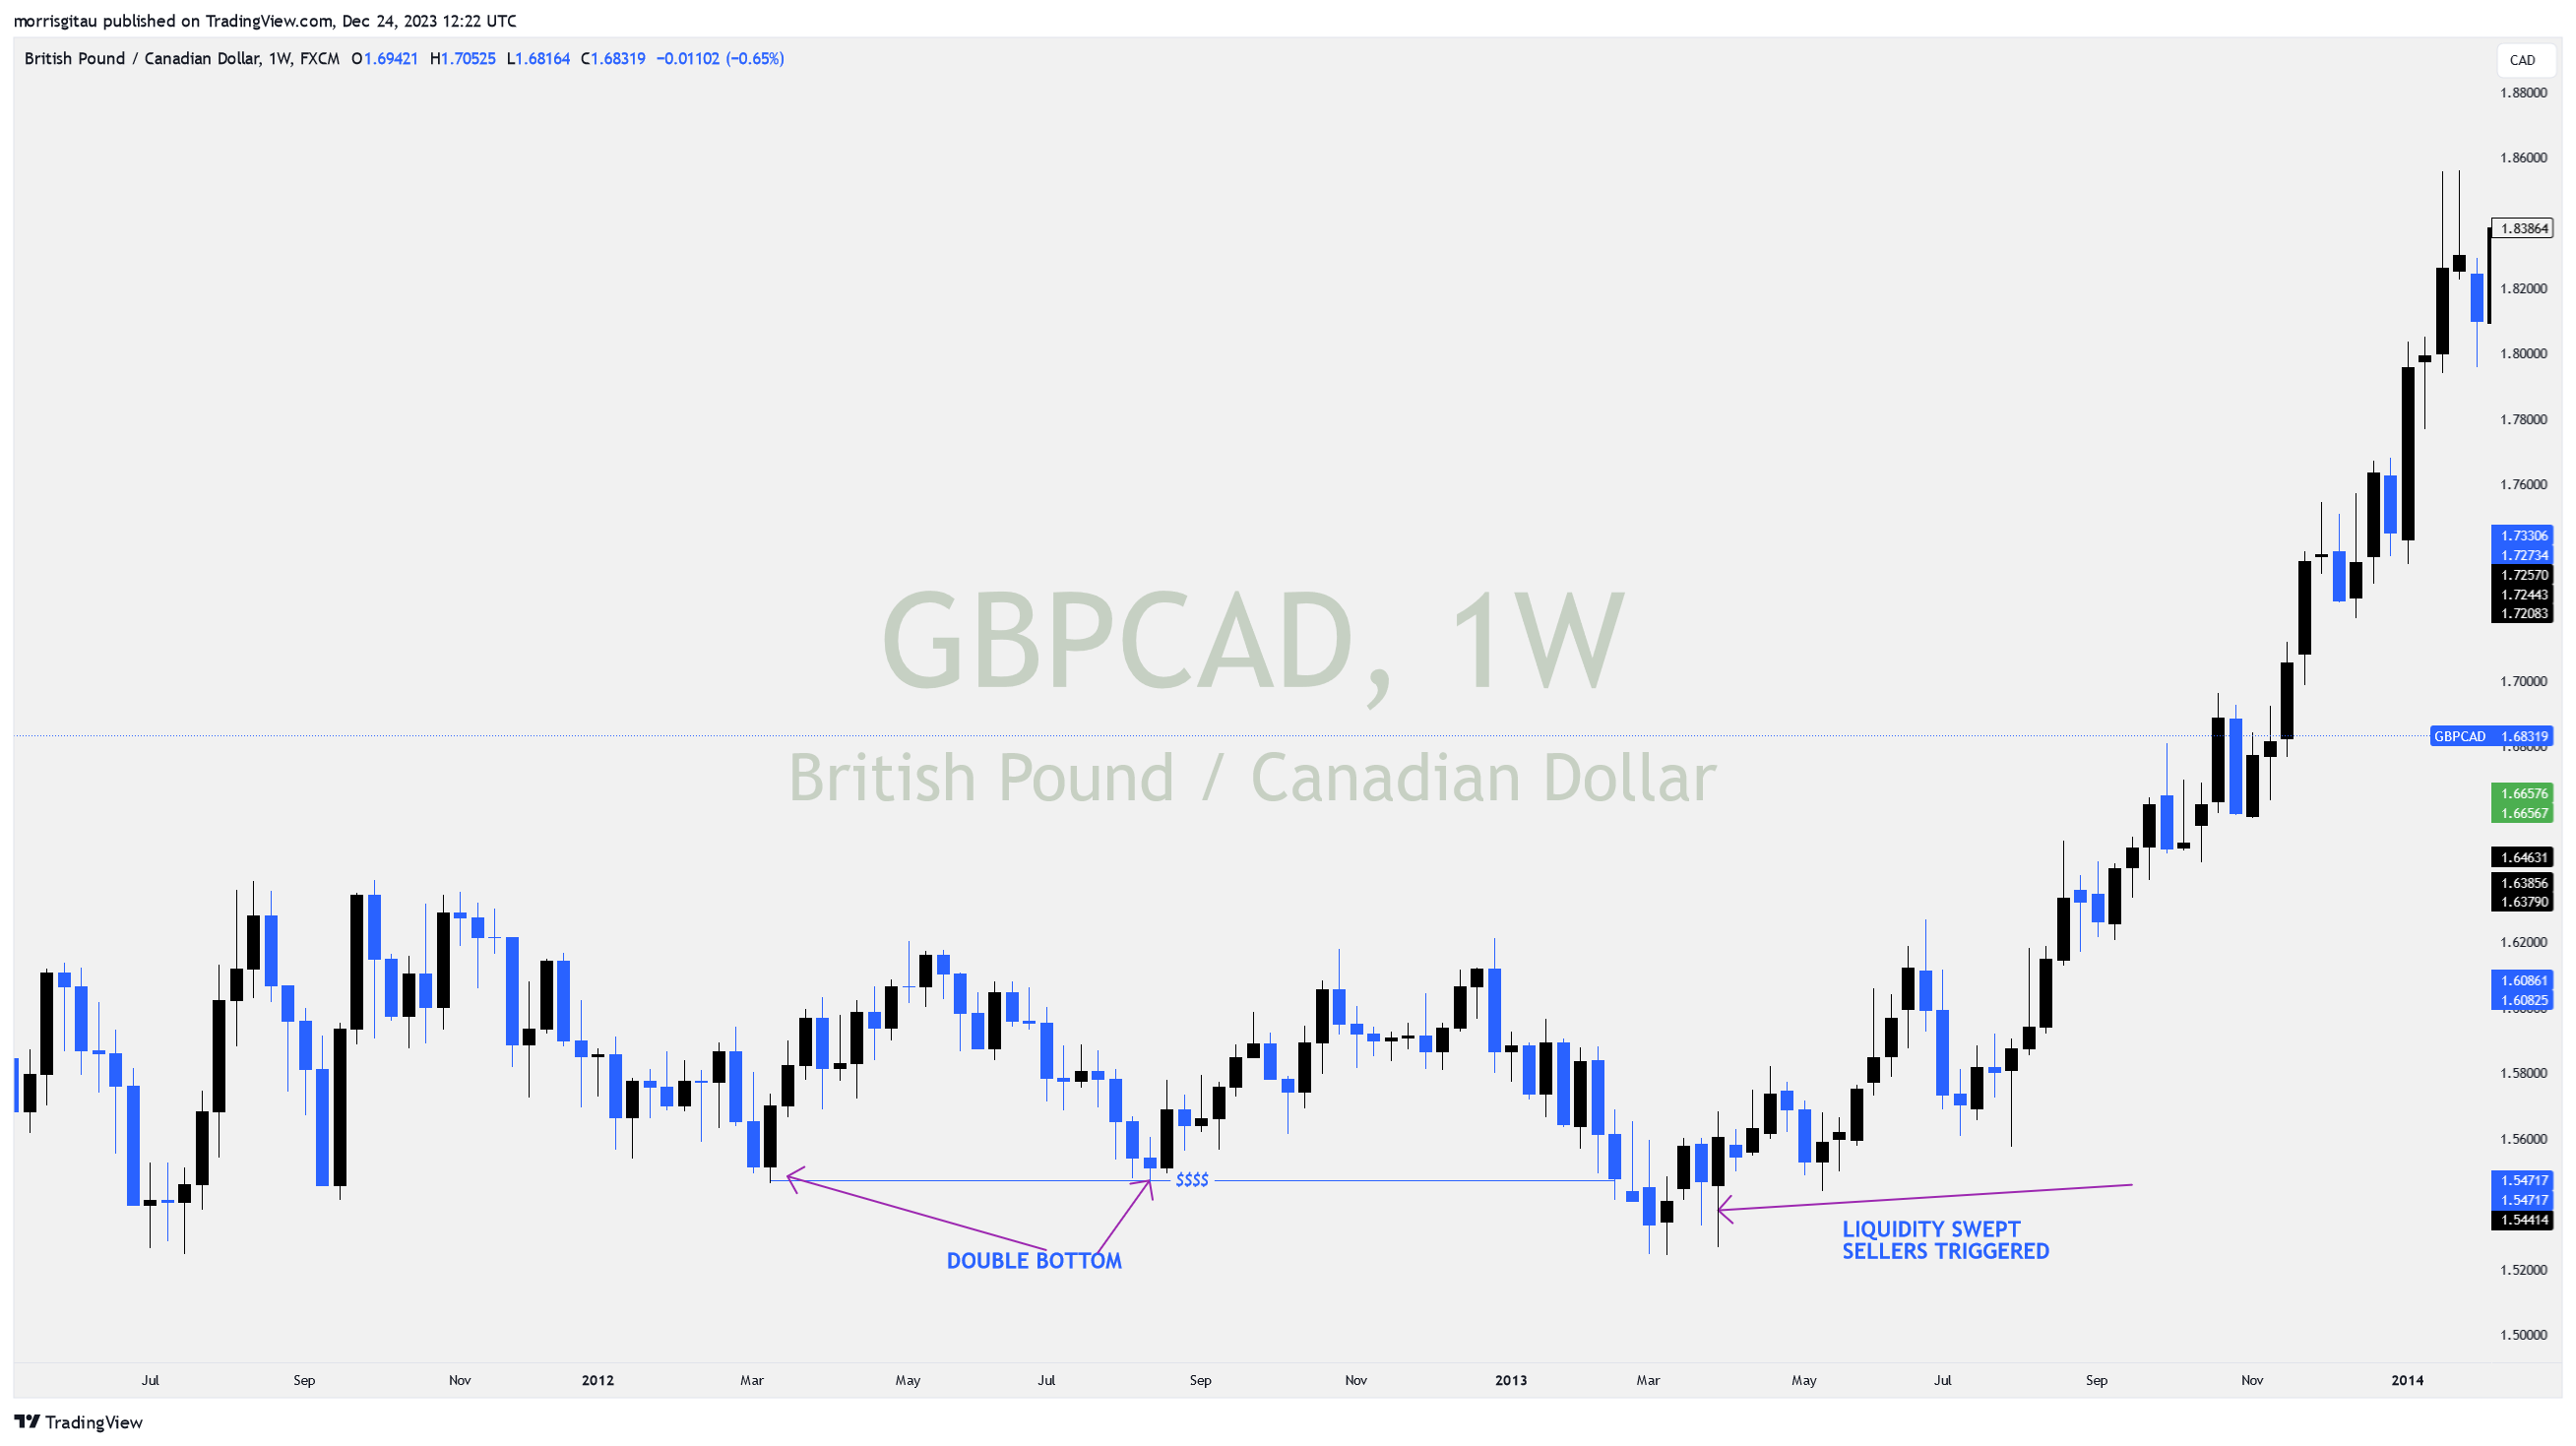
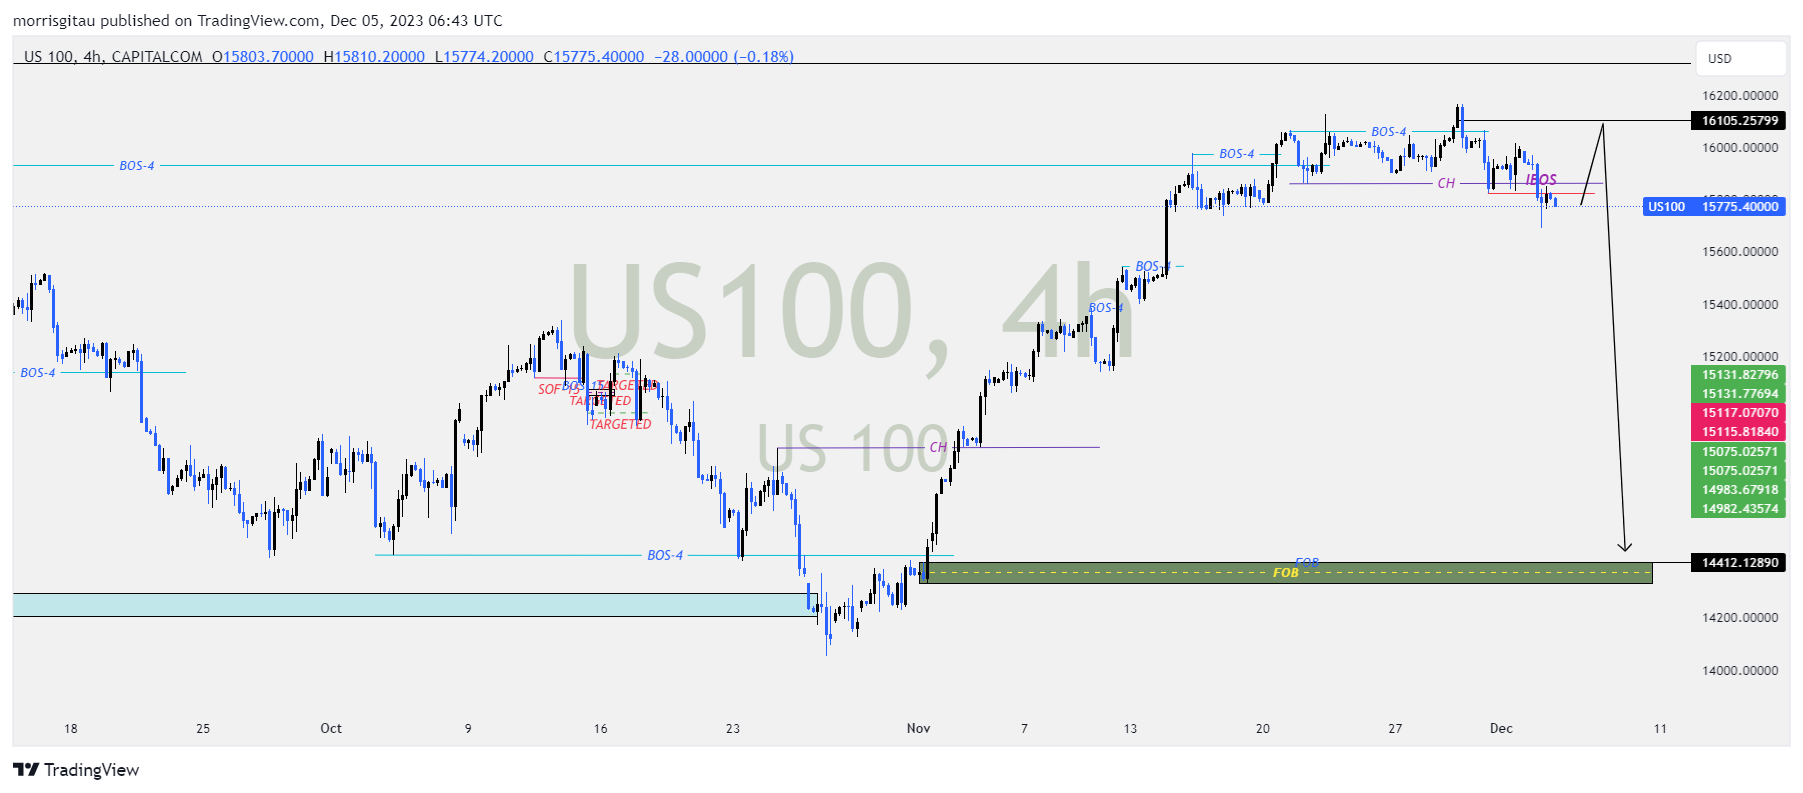
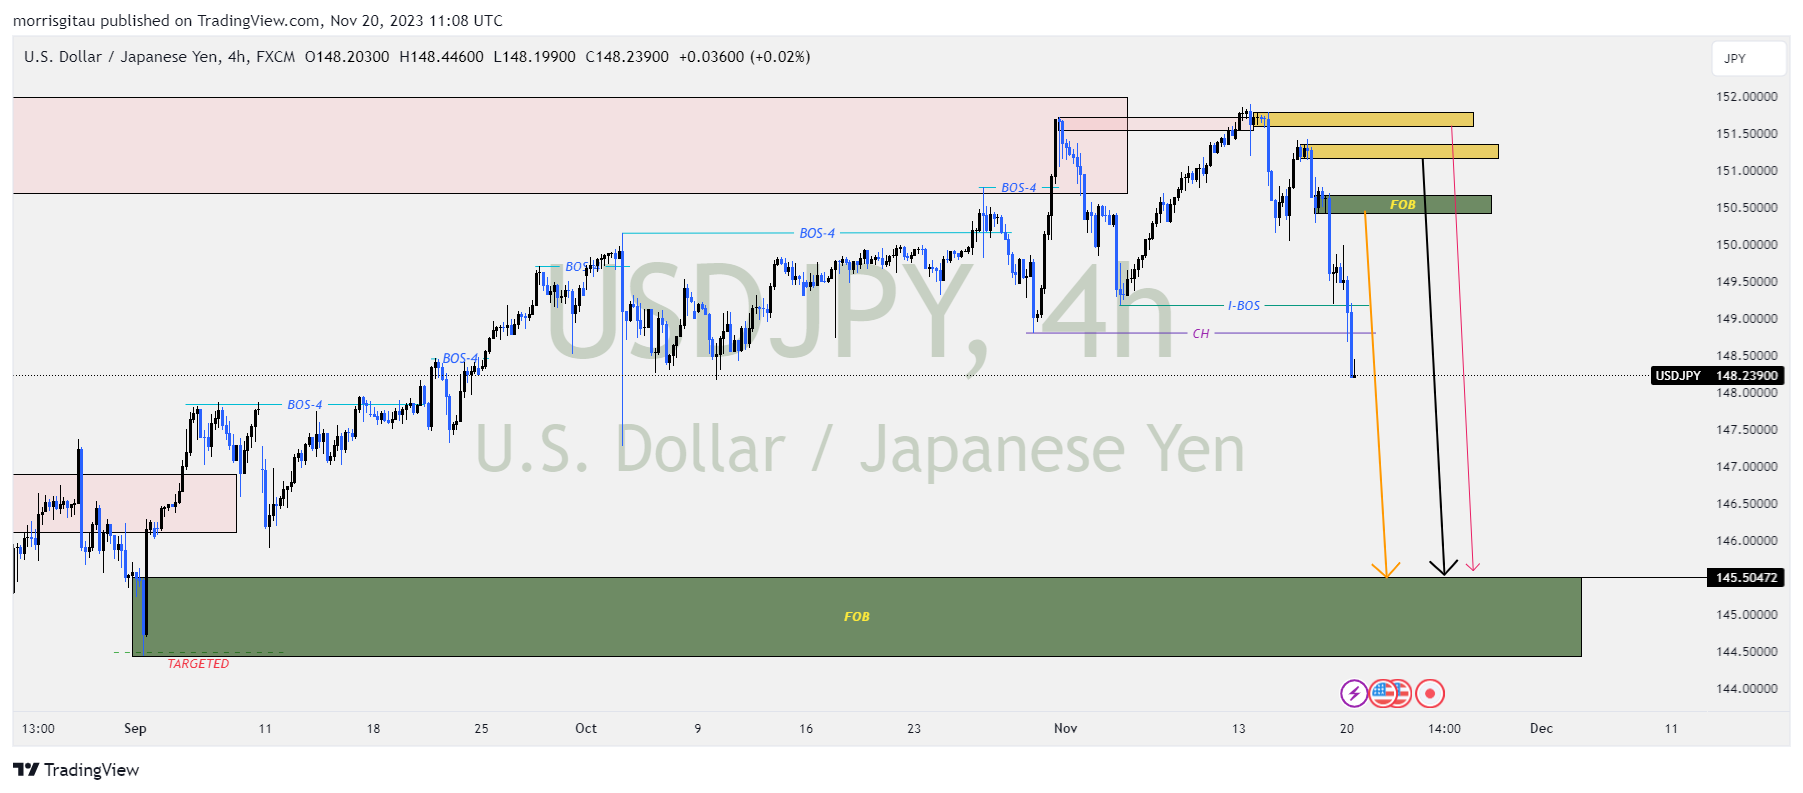
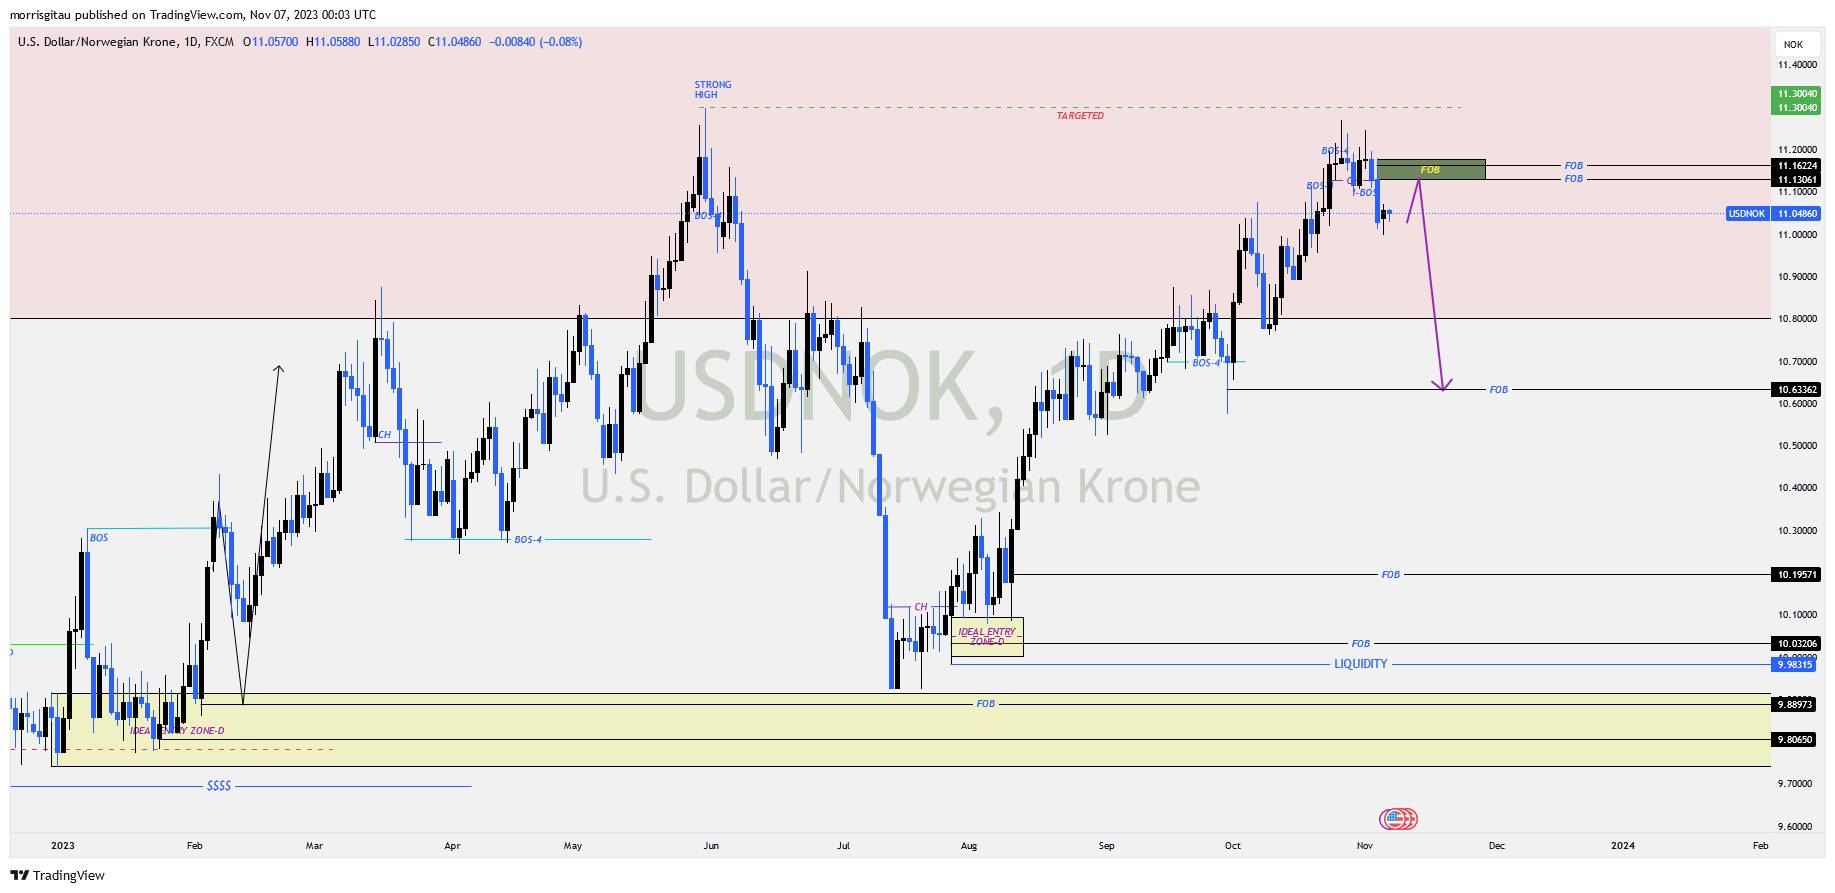
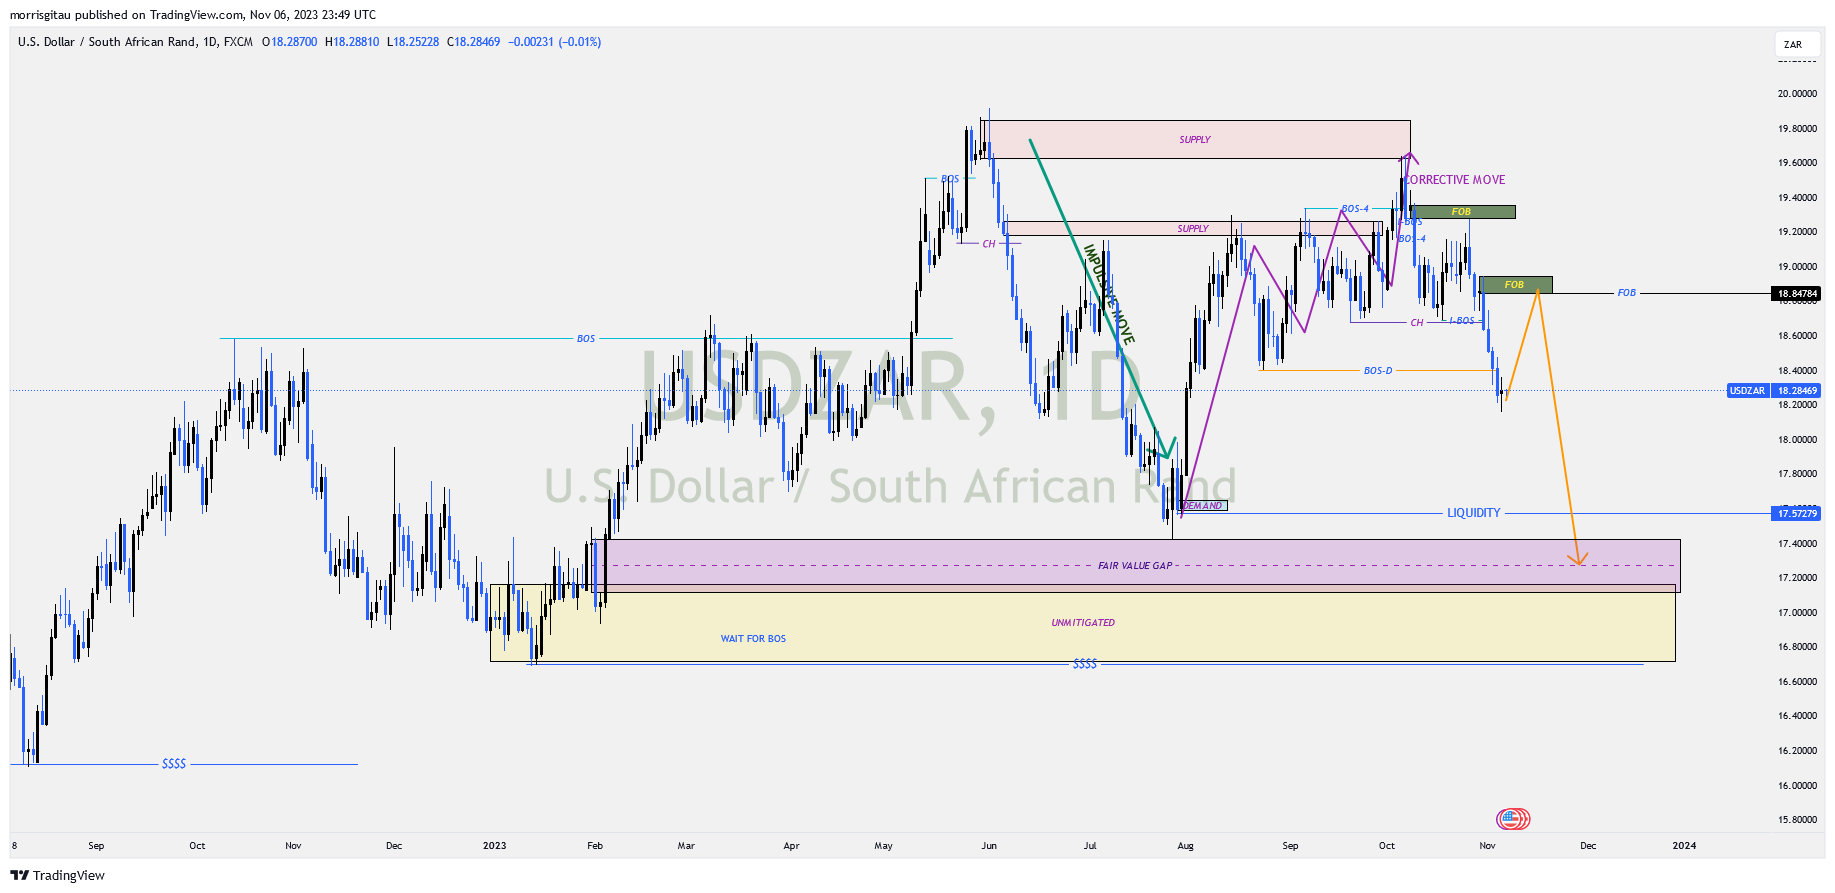
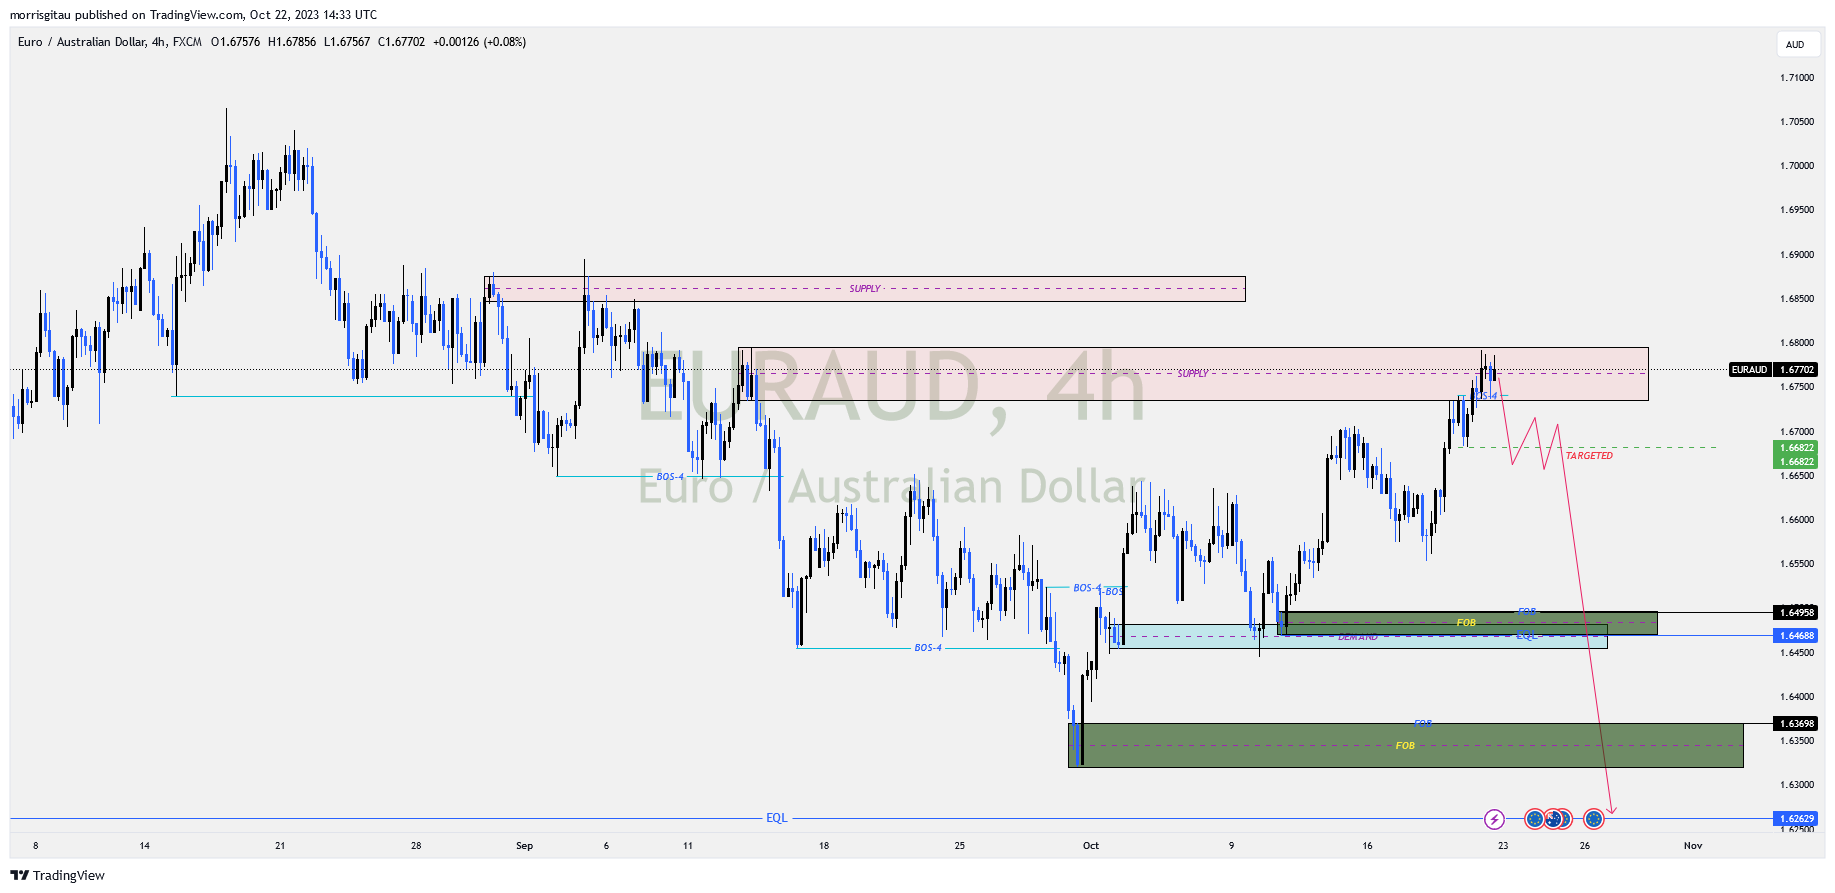
      Time and dedication are the answers to figuring out market and trader psychology. Time, is a trader’s greatest weapon or undoing. For example, we know, every break of structure is followed by a correction. The purpose of a correction is to remove previous disequilibrium (imbalance and inefficiency) before continuing with the main trend.

      What we don’t know is how long a correction will take or when the trend will change. Often times, the state of not knowing has caused may traders to act irrationally consequently blowing accounts.

      If we know this, then why do we fail? We project our feelings and expectations on the market. Recall, the market doesn’t care.

      Repeatedly court the market, sit and ask what is going on, why is it happening and how is it happening, the market will answer and increase your understanding and depth of psychology.

      SYNCING
      SYNCING

      When you do the following, market psychology has modified your behavior (psychology);

      1. You no longer chase after trades. Instead, you let trades come to you no matter how long it takes.
      2. You learn to differentiate between lost and missed opportunities.
      3. When you learn that high risk doesn’t necessarily equate to high return.
      4. Your objective is risk minimization and not profit maximization.
      5. When you accept that two people can see the same charts differently.
      6. Its about the quality and not the quantity of trades.
      7. When you learn that less is more, and slow is fast
      8. Excessive leverage is not your friend.
      9. Spreads and market manipulation don’t make you better or worse.

          In conclusion, it doesn’t matter what technique you use; market psychology is inevitable if you must succeed in your journey in forex trading. It is the case of what comes first, the chicken or the egg.


        • WHEN DESIRE TRUMPS REASON

          WHEN DESIRE TRUMPS REASON

          WHEN DESIRE TRUMPS REASON

          When desire trumps reason, disaster ensues.

          Desire ; a strong feeling of wanting to have something.

          Reason ; the power or ability of the mind to think, understand, and form judgments logically.

           A disaster is an event that results in great harm, damage, or death.

          Therefore, in summary, if Desire >Reason = Disaster.

          From the definition above, human beings should, by all means, endeavour to place reason above desire. However, our daily existence is a representation of the opposite. Our lives are filled with instances where we consciously let desires rule over us with consequences registered later on.

          In the world of retail forex trading, desire seems to rule supreme over reason. Like any other business, forex trading ascribes to the ebbs and flows of business cycles and phases. Consequently, it takes time to build mastery, a credible track record, and profitability.

          From the study of economics, we learn that an overwhelming desire for a product or service, otherwise known as demand leads to the creation of a market for that commodity. The overwhelming desire for supernormal profits in forex within the shortest time possible has led to the creation and rise of questionable ‘solutions’ in the form of;

          1. Proprietary software (indicators & robots)
          2. Account management and
          3. Unregulated investment services.

          Emphasis is placed on approaching forex trading as a business. Profitability is a result of consistency in learning, practicing, and implementing sound, reasonable trading practices. Note that your primary objective is learning then application of the concepts acquired.

          This journey takes time. Unfortunately, a majority of new entrants in the forex space do not desire to surrender themselves to the process of learning. Enter desire, exit reason. A quick survey on social media platforms leads you to gurus selling proprietary software or account management services. These services promise exponential returns in the shortest time possible. Desire goes into overdrive, imagination deludes you into believing that you will earn millions by a certain time. To some degree, hubris sets in. This ‘solution’ deludes us into thinking we are smarter than the rest.

          As mentioned earlier, businesses go through cycles and phases. Profits are a lagging indicator of what the business has implemented in the recent past. Reason therefore dictates that overnight or exponential short-term profits are an illusion. From this premise, the ‘solution’ is unsustainable and probably a scam. At this point, however, desire is strangling reason and we end up committing our resources. The outcome is usually disastrous, financially.

          Why do these ‘solutions’ fail?

          It goes back to an unhealthy and overwhelming desire for quick profits. Unhealthy and overwhelming desire to shorten the learning curve.

          In the case of account management and questionable investment services, we desire to cede control to a third party. Whoever is trading/managing your account has no attachment to the capital invested. They have no incentive to trade conservatively, eventually, they become reckless, especially in account management. This happens when we insist on eliminating the process of learning by ceding control to a third party.

          For instance, the account management below is found on Instagram promises 100% weekly profit. Upon close interrogation, you will notice the comments section is disabled. Why is it disabled? ideally you want to prevent honest realistic feedback from the public.

          FOREX ACCOUNT MANAGEMENT
          FOREX ACCOUNT MANAGEMENT

          Questionable investment services are a special kind of scam. Usually, you will see an ad on social media promising to exponentially grow your capital within a certain time. In addition to the ad, there is ‘evidence’ of individuals receiving large payouts. Automatically, your desire kicks in. Such services thrive in obscuring their true intentions under the guise of forex, crypto or other types of investment. I have seen many individuals ‘invest’ in such scams. There is no proof of actual investment or trading that takes place. The messages displayed on their social media pages have been fabricated and edited to elicit desire. Once your capital is committed, there is no recovery, thereafter it’s a series of ignored communication, reasons and excuses.

          Lets check this example below,

          Returns in 7 hours
          Returns in 7 hours


          The page conveys the information that within 7 hours, you will earn exponential profits. Let us go further and see what else is visible from this account.

          FAKE CBK
          FAKE CBK


          Interestingly, the page also displays fake information. The letterhead from the Central Bank of Kenya lends credibility to this page. However, further investigations reveal that the Capital Markets Authority maintains a list of all licensed brokers in Kenya. Multivest LLC number 112 is not part of the list. Therefore, this would constitute fraudulent behaviour.

          Below is the actual list from the Capital Markets Authority

          CMA LIST
          CMA LIST


          Finally, we look at the logo which is a replica of a well-known prop firm; City traders Imperium. There idea is to use such logos to lend credibility to the scam.

          CITY TRADERS IMPERIUM PAGE
          CITY TRADERS IMPERIUM PAGE

          There is a possibility a lot of individuals have fallen victim to this scam driven by the universal overwhelming desire to become wealthy in the shortest time possible.

          Proprietary software (robots & indicators)

          People tend to procure this ‘solution’ because it allows us to transfer our analytical and reasoning abilities to software that tells us when to act. Human beings tend to prefer the path of least resistance. We do not necessarily desire to submit to the process of learning, instead we desire shortcuts. Unfortunately, we do not know what information the software uses to make decisions or even how it works. We are not interested in asking such questions, if we asked such questions, we would be forced to learn how to trade which consumes time, and time that we do not intend to dedicate to the process of learning.

          For instance, the Instagram page below advertises an indicator claiming you will earn 500$ daily. Note, the comments on this Instagram page are disabled.

          FOREX INDICATOR
          FOREX INDICATOR

          For the sake of clarity, there are forex robots that do work. However, they are not affordable and accessible to low & middle-income traders. Such bots cost at least 5000$. Further, these bots require a well-capitalized account of at least the same amount as the purchase price.

          Nothing comes to you by osmosis or desire. You must work for it. What you invest in, you become good at. Ceding control to our desires and thereafter to third parties leads to unhealthy exposure to risks and outcomes. Often it ends in disaster.

          I am no exception to this weakness. Severally, I have let desires overrule my reasoning, the outcome of course is predictable. In response to the disastrous outcome, I forced myself to learn the art of forex trading.

          If we all submitted to the process of learning, practicing, and improving our forex trading craft, we would be in control of the risk exposure and the accompanying outcomes thereby guaranteeing a higher chance of success.

        • FOREX OUTLOOK 2024

          FOREX OUTLOOK 2024

          FOREX OUTLOOK 2024

          Here are my thoughts on the forex outlook 2024. We have had multiple pairs showing signs of reversal and continuation. I will use supply and demand concepts to analyze where I think the market will head in 2024.

          GBPUSD

          On the monthly charts we have a long term bearish scenario. After a break of structure, the price hit the demand zone and corrected for the better part of 2023.
          Moving down to the weekly charts, we see a mitigation of a previous supply, thereafter there was a reaction to the downside creating a bearish order flow.
          On the daily charts, we have correction that seems to have come to an end. We have a bearish bias with no confirmation. We are awaiting for a break of key price levels to confirm our bearish outlook. If that happens, we are targeting the demand at 1.21656.
          Should the market break higher, we are awaiting for it to settle at 1.20-1.30 price levels.

          GBPUSD CHART
          GBPUSD CHART

          AUDUSD

          On the monthly chart we have a bearish long term outlook. The price completed a correction at 0.90-1. Thereafter we are in a bearish continuation on the monthly chart.
          On the weekly charts, we are nearing the end of a bullish correction that may reverse or continue slightly higher. Looking closely, we also seem to be in a consolidation awaiting a proper breakout, our bias presently is a bearish set up though we do not have confirmation.
          Presently, on the daily charts, we are waiting for a clear direction, either a break to the upside targeting liquidity at 0.692 or higher targeting the unmitigated supply at 0.7. Alternatively, we could have a break to the downside targeting the liquidity at 0.63 or fresh demand at 0.626.

          AUDUSD CHART
          AUDUSD CHART

          USDJPY

          On the monthly chart, the price has completed a long term market correctio. We have seen a reaction from the monthly demand indicating order flow has shifted to bearish.
          On the weekly charts, we have an internal shift in order flow and a correction that is complete confirming our long-term bearish outlook.
          On the daily charts we anticipate a correction to mitigate the 146-147 region, there is a possibility the market might go higher so we will wait for confirmation for either buy limit targeting 146-147 or sell limit from the same region or higher.

          USDJPY CHART
          USDJPY CHART

          GBPCHF

          Cross Swiss Franc (CHF) pairs remained subdued for the better part of 2023. Towards the close of the year we saw signs of recovery though it was short lived. On the monthly chats, we have a break of structure, consequently, we are yet mitigate the supply at 1.20, that informs our bearish bias.
          On the 4 hour chart, we are yet to get a clear confirmation though we anticipate the price will break lower before reversing to the projected upside of 1.11 -1.13

          GBPCHF CHART
          GBPCHF CHART

          GBPCAD

          A resurgent British pound and declining oil prices have resulted to a strong bullish move on the monthly chart that has mitigated a previous supply.
          Presently still on the monthly chart we are registering strong bearish orderflow.
          Presently on the 4 hour chart we are awaiting confirmation, a bearish continuation or a minor bullish correction targeting the unmitigated supply above before a bearish continuation.

          GBPCHF CHART 2024
          GBPCHF CHART 2024

          Join my premium forex channel for exclusive access to swing trading set ups.


        • 2024 OIL OUTLOOK

          2024 OIL OUTLOOK

          2024 OIL OUTLOOK

          On the monthly charts, we have a consolidation around a strong demand level. On the weekly timeframe, we do not have a clear direction though the market seems to be pushing higher to mitigate inefficiencies at the 107-115 levels.

          Dropping down to the 4-hour chart, we have a bullish bias targeting 77-90 levels. Change of character plus flip zones in addition to multiple breaks of structures inform our bullish bias. Once we cross into 2024, we expect a further slide down to the unmitigated zones in yellow or green to collect buy orders before pushing higher. Oil is positively correlated with the Canadian dollar (cad), such that an rise in oil prices boosts CAD and the reverse is true. Moving forward we are also seeking cross CAD set ups.

          UK OIL
          UK OIL
          US OIL
          US OIL

          Our analysis is based on smart money concepts particularly supply and demand. We practice a conservative approach to forex trading that ensures risk minimization.

        • LIQUIDITY IN FOREX TRADING

          LIQUIDITY IN FOREX TRADING

          LIQUIDITY IN FOREX TRADING


          Understand that for a trade to occur, there must be two counterparties; a buyer and a seller i.e. for every buyer, there must be a seller and the reverse is true. Liquidity is the ease with which one can convert an asset to cash without losing significant value.

          For instance, if you have an asset priced at 4$ and you can sell it/convert it to cash it is because there is liquidity, the willingness of another party to accept the asset at 4$. However, if we have to offer the asset for sale at a lower price to convert it to cash, let’s say at 3$ then there is no liquidity in the market. This lack of liquidity happens when we do not have enough buyers or sellers for a particular asset, hence the significant discounts to attract them. This concept is not only applicable in forex, it is one of the key concepts that drives the forex market.

          Every buy transaction must have a willing seller and vice versa. If this situation cannot hold, suppose we do not have a willing counterparty the market must create/engineer liquidity. Retail forex traders refer to this concept as market manipulation while institutional traders refer to this concept as engineering and sweeping liquidity. Engineered liquidity facilitates large institutions to come into the market efficiently. Liquidity ensures volumes of currencies are traded efficiently.

          NB; If you cannot identify liquidity, chances are you are the liquidity waiting to be swept.


          How to identify liquidity?

          To understand liquidity concepts, we must first understand how retail traders look at the markets. Retail traders use popular techniques to analyze the markets such as trend lines and patterns. Institutional traders on the other hand tend to use more technical concepts such as smart money concepts (SMC) or institutional order flow.

          Some of the popular concepts used by retail traders include;

          • Double bottom, triple bottom, or equal lows.

          Formed when markets create two or three equal lows. Usually, retail traders use this pattern to buy with a stop loss just below.

          DOUBLE BOTTOM
          DOUBLE BOTTOM
          • Double top, triple top, or equal highs.

          Formed when markets create two or three equal highs. Usually used by retail traders to sell with a stop loss above it.

          DOUBLE TOP
          DOUBLE TOP
          • Trendline

          Trendlines are formed when markets move within an upward or downward channel.

          In an upward channel, retail traders buy when the market touches the lower trend line and sell when the market touches the upper trend line.

          UPWARD CHANNEL
          UPWARD CHANNEL

          In a descending/downward channel, retail traders sell when the market touches the top trendline and buy when the market touches the bottom trendline.

          DOWNWARD CHANNEL
          DOWNWARD CHANNEL

          How is liquidity engineered?

          Recall that for a trade to occur, we require two counterparties, a buyer and a seller.

          Let’s start with a double bottom.

          The first image on the right represents the present market conditions where retail traders have already bought at points A1 and A2 with their stop losses sitting just below A1 A2. Presently, the market is at point A. Institutional traders want to enter the market and buy, however, there are no willing counterparties i.e. sellers. At point A, institutional buyers have the ability but are also not willing.

          So how will the institutional buyers get into this market? By engineering liquidity that will attract sellers into the market. Once enough sellers are availed, they will buy at a lower point as originally intended.

          DOUBLE BOTTOM LIQUIDITY
          DOUBLE BOTTOM LIQUIDITY


          How will they do this?

          Since there are few sellers, they will become the sellers and push the market lower from point A towards A1 A2. Remember that institutional traders do have the financial muscle to push markets in either direction. As the market pushes lower, retail traders see this as a signal to add more buys. Why? The illusion is that this is now a triple bottom and, therefore, a buy. At this point, the sellers(institutional) are matching the buyers. What retail traders on the buy side don’t know is that the institutional traders seek to drive markets even lower, sweeping the set stop loss and recording it as their profits.

          Once the sweeping is done by pushing prices lower, the retail sellers are alerted. Sellers jump in thinking the market is now bearish. Once enough sellers are in, the institutional traders now become buyers as they had originally intended and push the market higher thereby trapping sellers.

          GBPCAD DOUBLE BOTTOM
          GBPCAD DOUBLE BOTTOM

          The image above depicts this liquidity phenomenon perfectly where liquidity was engineered to trigger and trap sellers.

          Double top

          We will build on the earlier concept and look at double tops. Presently, the market is at point A. Retail traders having spotted the double top have sold (short selling). At the current market price, institutional traders are able but not willing to sell at this price. Recall that supply is the price at which sellers are able and willing to sell, usually at a high price. Also recall that for sellers to enter the market, we need a counterparty, buyers in this case. Presently, there is no liquidity because we have no buyers. So how will institutional traders get into this sell market? They will engineer liquidity and push prices higher and sweep stop losses (A1 A2).

          DOUBLE TOP LIQUIDITY
          DOUBLE TOP LIQUIDITY

          How will they do this?

          Firstly, they will volunteer to buy and push prices higher towards A1 A2 targeting stop losses at this region which shall be recorded as profits. As the prices approach A1 A2, more sellers are attracted thinking it’s a triple top/equal high.

          DOUBLE TOP LIQUIDITY
          DOUBLE TOP LIQUIDITY

          Institutional traders push the prices well beyond A1 A2 and trigger buyers into thinking it’s a bullish break of structure. When enough buyers are in the market (providing the much-needed liquidity), institutional traders will now sell as originally intended as depicted in the image above.

          How about trendlines

          Apart from double tops (equal highs) and double bottoms (equal lows), retail traders also use trendlines; upward and downward.

          Retail traders use the trendline concept to place buy or sell orders. From a theoretical perspective, once the price hits a trendline (top or bottom) retail traders place trades.

          TRENDLINE LIQUIDITY
          TRENDLINE LIQUIDITY

          Once price hits A1, A2, and A3, retail traders buy. Once prices hit B1 and B2, retail traders sell; a fairly simple concept. In this upward channel, suppose prices are at point A, institutional buyers want to buy but not at that price; A. At that price we have an imbalance, more buyers want to come in but no sellers to offer a counter position. Just like before, liquidity will be engineered.

          Institutional traders will offer to sell and drive prices towards A1, A2 and A3. From a retail perspective, every time the price touches the lower trend line retail traders buy with stop losses below. Institutional traders know this and that’s what they are targeting. They will drive prices lower, and more buyers thinking the trend line will hold will buy. Institutional traders want to create liquidity for themselves to enter and place buy orders, therefore, they will drive prices lower, beyond A3, and wipe out previous buy orders (sweep the stop losses). Once this act is complete. Sellers will think it is a breakout and mount numerous sell orders. Once we have sufficient sell orders, institutional traders enter and place buys as originally intended. 

          TRENDLINE LIQUIDITY
          TRENDLINE LIQUIDITY

          NB: The concept above is also applicable for a sell in an upward channel and both sell and buy in a downward channel.


          How to use liquidity to your advantage?

          Liquidity drives markets and facilitates efficient trading in any type of business and market. In forex, I use a combination of fresh order blocks and liquidity to inform my trade entry (limit orders) and exits (take profits). Join my course to learn more about liquidity and forex trading.


        • FOREX WATCHLIST WEEK 49, 2023

          FOREX WATCHLIST WEEK 49, 2023

          FOREX WATCHLIST WEEK 49, 2023

          XAGUSD

          On the weekly timeframe, we have bearish trend with minor corrections. Presently, we are in the tail end of a bullish correction. On the 4 hour charts we have registered a change of character signaling a reversal of trend is in the horizon.

          XAGUSD CHART
          XAGUSD CHART


          EURUSD

          For the better part of 2023, we have maintained a bullish bias. However, on the weekly timeframe we have confirmed reversal to the downside to correct inefficiencies at 1.00 price handle. The bullish correction has come to an end. On the 4 hour chart we have a change of character confirming the reversal. Once we have a second confirmation, we can trade this pair targeting the weekly low of 1.047 price handle.

          EURUSD CHART
          EURUSD CHART


          EURCAD

          On the monthly timeframe, we have a strong bullish momentum. The bullish momentum has created inefficiencies that the market seeks to correct. On the daily charts, we have a new low and lower high formed indicating signs of a bearish correction. On the 4 hour chart we have a change of character confirming a bearish set up. Once we have a minor bullish correction, we will seek sell limit orders.

          EURCAD CHART
          EURCAD CHART


          AUDJPY

          The Japanese Yen has had a lackluster performance in 2023. Talk of Bank of Japan intervention has not slowed the bearish trend. There are signs of reversal of the Yen across. On the 4 hour chart, we have an internal and external break of structure confirming a bearish bias.

          AUDJPY CHART
          AUDJPY CHART


          US 100

          US100 and US Dollar have a negative correlation, when one rises, the other falls. In the last one month, the US Dollar index, DXY has been in bearish correction while the US 100 has been in bullish correction. The correction seems to have come to an end with the US100 registering both internal and external breaks. We anticipate a minor correction to activate our sell set ups targeting the inefficiency on the downside.

          US 100 CHART
          US 100 CHART
        • FOREX WATCHLIST WEEK 47,2023

          FOREX WATCHLIST WEEK 47,2023

          FOREX WATCHLIST WEEK 47,2023

          As the year draws to a close, we are witnessing major shifts in structure across multiple pairs. Low liquidity is a prevailing phenomenon in Q4, therefore, exercise caution.

          USDJPY

          Finally, there are signs of shift in market structure from bullish to bearish. On the 4 hour chart, we have an internal break of structure and a change of character. This informs our bearish set up. On the retracement, we shall seek sell limit order(s) at either unmitigated or fresh supply.

          USDJPY CHART
          USDJPY SELL SET UP
        • FOREX WATCHLIST WEEK 45,2023

          FOREX WATCHLIST WEEK 45,2023

          FOREX WATCHLIST WEEK 45,2023

          USDZAR

          In Q2 of 2023 we saw an impulsive bearish move. Presently we have completed a bullish correction that has shifted order flow from bullish to bearish. We have a break of key structure on the daily time frame. Presently we are awaiting a minor bullish correction targeting the FOB then resume the bearish order flow.

          USDZAR CHART
          USDZAR SHORT SET UP


          USDMXN

          Presently we are in a profit taking season against the dollar that has sponsored a bearish outlook. We have a change of character and break of structure that informs our bearish outlook targeting the unmitigated demand at 16.76 price handle. We are anticipating activation of our sell li it orders at 18 price handle.

          USDMXN CHART
          USDMXN SHORT SET UP


          USDNOK

          A failure to break the former high and a shift in orderflow from bullish to bearish informs our sell limit set ups. Presently we have a change of character and a break of structure. We anticipate a minor bullish correction to activate our sell limit orders at 11.16 price handle.

          USDNOK CHART
          USDNOK SHORT SET UP


          BTCUSD

          Profit taking has pushed the dollar lower across major instruments. Presently we anticipate bitcoin to gain more ground against the dollar possibly hitting the 37,000 price handle. Thereafter we shall await a shift in order flow and market structure before placing sell orders.

          BTCUSD CHART
          BTCUSD CHART


          USDCAD

          We have a change of character and an internal break of structure that informs our sell lomit order. Possible resurgence in oil prices coupled with profit taking against the dollar is expected to push the dollar lower against the Canadian dollar. We anticipate a minor bullish correction to activate our sell limit orders at 1.38376.

          USDCAD CHART
          USDCAD SHORT SET UP

          XAUUSD

          On the 4-hour chart, we have a change of character and a break in internal structure. That informs our reversal/shift in market structure. We anticipate a minor bullish correction to activate our sell limit orders at the 1994 price handle.

          XAUUSD CHART
          XAUUSD CHART
        • FOREX WATCHLIST, WEEK 43 2023

          FOREX WATCHLIST, WEEK 43 2023

          As we draw to the close of 2023, we will be experiencing lower liquidity as the weeks go by.

          GBPCHF

          Finally, we have a break of structure and break of weekly swing structure. There is a possibility of a bullish correction (red0 or bearish continuation (black). We will only trade once we have a clear set up. We do favour a bullish correction before thereafter a bearish continuation.

          GBPCHF CHART
          GBPCHF CHART

          XAUUSD

          As 2023 draws to a close, we are witnessing DXY profit taking. Cross USD pairs are registering a brief bullish correction and the same is evident for XAUUSD. Presently, we anticipate GOLD to mitigate the supply in green, thereafter we will look for sells or a bullish continuation.

          XAUUSD CHART
          XAUUSD CHART

          EURJPY

          The Bank of Japan (BoJ) has given signs of intervention to prevent the decline in the Yen value. Presently, we have a bullish correction targeting the unmitigated region of 159. Once this region is mitigated, we will be on the look out for sells targeting the liquidity below at 155.

          EURJPY CHART
          EURJPY CHART

          XAGUSD

          Increased profit taking against DXY and the ongoing conflict between Israel and Palestine has fueled the rally in precious metals. We have broken above key levels in an attempt to mitigate the supply sitted above. We are awaiting the completion of the bullish correction thereafter we shall look for sell set ups.

          XAGUSD CHART
          XAGUSD CHART

          EURAUD

          We are looking at a possibility of sell set ups. We are in a major bearish trend that is presently correcting itself. Should we have a break of structure, we will look for sell set ups targeting the liquidity below the lower structure.

          EURAUD CHART
          EURAUD CHART
        • FOREX COPY TRADING

          FOREX COPY TRADING

          Forex copy trading is a modern approach to participating in the foreign exchange (Forex) market, offering individuals an opportunity to engage in currency trading by mirroring the strategies and actions of experienced and successful traders. This innovative concept bridges the gap between seasoned traders and newcomers, democratizing the world of Forex by allowing less experienced traders to emulate the trading decisions of more knowledgeable professionals.


          At its core, forex copy trading operates through specialized online platforms or brokers that facilitate the connection between two distinct roles: strategy providers (the seasoned traders) and followers (the less experienced traders or copiers). The strategy provider’s trading activity is automatically replicated in real-time in the follower’s trading account, with each trade executed in proportion to the follower’s investment.

          One of the significant advantages of forex copy trading is accessibility. It grants entry to the complex world of Forex trading without the need for extensive knowledge or experience. For beginners, this can serve as an invaluable learning tool, allowing them to observe and comprehend the strategies employed by experts.

          However, it is essential to note that forex copy trading comes with its share of challenges. Successful trading depends on the competence and consistency of the chosen strategy providers. Therefore, selecting the right traders to follow is crucial. Additionally, while copy trading provides access to potential profits, it also exposes followers to potential losses, as unfavorable trading decisions made by strategy providers will be mirrored in their accounts.

          To maximize the benefits of forex copy trading, it is advisable to conduct thorough research when selecting strategy providers, set clear financial goals, establish risk management strategies, and regularly monitor and adjust your portfolio as necessary.

          In summary, forex copy trading has revolutionized how individuals engage with the Forex market. By enabling less experienced traders to follow the strategies of experts, it offers a unique learning experience and the potential for financial gains. However, it is essential to approach it with caution, select strategy providers wisely, and employ effective risk management to navigate the inherent challenges of this trading method.

          Forex copy trading is recommended for individuals who are interested in wealth creation in the forex space. It is particularly well-suited for beginners who want to learn about Forex trading by observing and emulating the strategies of experienced traders. Additionally, it can be beneficial for those who seek diversification in their investment portfolios and are looking for an accessible way to potentially generate returns through Forex trading without the need for in-depth market analysis. However, it’s important for individuals considering forex copy trading to conduct thorough research, carefully select signal providers, and have a clear understanding of the risks involved to make informed decisions and maximize the potential benefits.

          Check out my Windsor Brokers, Ingot Brokers and HF Markets Copy trading profiles